
ShopFloorMonitoring is fully integrated into ShopFloorManager's Architecture inheriting the intrinsic: foundational features, security, intra-operability, look and feel, internal data exchange and document control mechanisms as does the rest of ShopFloorManager's Applications!
Note: See our Automation Section for details on IIoT Monitoring & Dashboards! addressing the 4.0 Industrial Revolution & Digital Transformation!
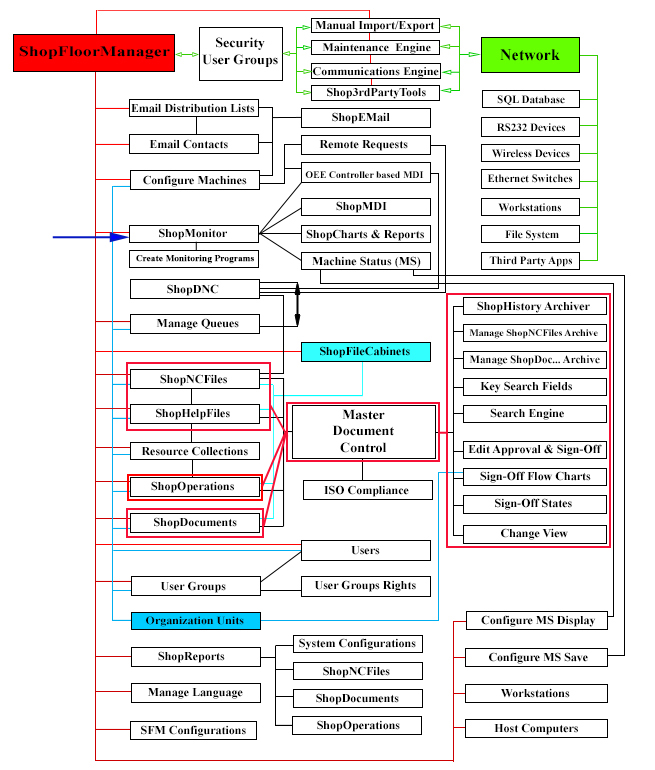
Note: Interrogate the Graphic above to investigate the various Application's Intra-Relationships by clicking on the Rectangles.
ShopFloorMonitoring includes the following Features:
Real-Time Viewing of TEEP, OOE, OEE & Production Status.
What is machine monitoring and why is this important to a manufacturing company? Manufacturing is continually driven to improve Machine Effectiveness, Production Efficiencies, Asset Usage, Quality, Customer Satisfaction and to Reduce Costs! Machine Monitoring is an important Technology used in meeting these Goals!
The Machine Monitoring we are talking about doesn't involve adding any additional hardware above and beyond what is required for DNC. It relies on technologies that virtually every modern company and all of it's CNCs have incorporated: Networking, Macros & DPRNTs.
ShopFloorMonitoring was designed around these technologies and around the International Standards: TEEP, OOE, OEE & Performance. It provides real-time Visible Production Status whether you are in the Office or on the ShopFloor! It is fully integrated with ShopDNC & your CNCs and provides all the Tools needed to mine the collected TEEP, OOE, OEE & Performance Data.
This "Mined" Data is then used to generate real-time interactive Machine Status Events, ShopFloorCharts and many ShopFloorReports allowing access to real-time production status so you can correct production problems immediately helping you to meet your established productivity goals!
Note: Investigate the various selections in the Navigation Bar for more details!
As Office or Shopfloor personnel are engaged in the daily task ShopFloorMonitoring's Machine Status Window is reflecting what is happening on the ShopFloor by continually updating its display with the production Telltale Icons. As the User occasionally glances at the Machine Status Window any Production changes/problems are immediate displayed.
These Telltale Icons were designed to temporarily engage a User to focus their attention on Production Problems as they glance at the Machine Status Window.
These Visuals have to fully encapsulate what's going on NOW and this has to be accomplished with a single Glance! If Users have to stop and
think about it, they won't! So these Symbols must be like a Stop Sign.  Everybody knows what happens if you don't heed that Warning!
This led us to design ShopFloorMonitoring to output real-time Telltale Ranking Icons that Visually captures a Users' Attention and uniquely indicates the Problem and what steps must be taken to address the Production Problems!
This led us to design a set of Tools that allow a User to quickly locate Production Problems within 10 minutes from when the User recognizes the Telltale Ranking Icons and starts the process to locate the Production Problem Areas.
To meet these Time Restrictions & Production Goals resulted in the following Visual to Digital Hierarchy Approach.
ShopFloorMonitoring is fully integrated with ShopDNC & CNCs and provides all the necessary tools to analyze the captured data from CNCs & User inputs. The captured production data is immediately analyzed by ShopFloorMonitoring and displayed in Real-Time via the Machine Status Window, ShopFloorCharts & ShopFloorReports using TEEP, OOE, OEE & Performance Standards! In other words when changes happen management & shop personnel know immediately where potential & active production problems are located!
Note: The Machine Status Window displays real-time Production Status by displaying up 10 different Status Ranking Icons that indicate the present Production Status and if these are Problems what are the possible steps that should be taken!
Creating Programs to match Your Company's Unique Paradigm
CCI's ShopFloorMonitoring is a configurable application supporting Customer Creatable Machine Monitoring Programs, Automatic Collection of Machine Events (No Operator Interaction Required), TEEP, OOE, OEE & Performance Data Entry Application (ShopFloorMDI), and an alternative data entry method, "OEE-Controller based MDI" Data Entry "Application" replacing the need for Scanners.
All collected data is immediately displayed in the Machine Status Window, ShopFloorCharts and ShopFloorReports at any configured Workstation whether on the Shop Floor or in the Office!
ShopFloorMonitoring includes a complete set of Modifiable Monitoring Programs so from the very first day you can collect accurate, searchable TEEP, OOE, OEE and Performance Data to use for real-time ShopFloorCharts, ShopFloorReports and for locating any questionable OEE Events. Using this Data you can improve Machine Effectiveness, Shopfloor Efficiencies, Quality, etc.!
The Monitoring Programs include:
Some examples of non-production programs include: Maintenance during Non Scheduled Times, Wrappers around particular sections of a ShopNCFile to collect intra cycle times, Wrappers around specific sections of a ShopNCFile that automatically email details of the Wrapped section to specific email-recipients, etc.
These programs can include probe data, internal sub-program cycle times, Wrappers that can be executed to collect pertinent Macro Data after running specific production runs, etc.!
OEE Standard Programs for collecting the Big 6 Problem Areas
The OEE calculation (Availability x Performance x Quality) rolls the "6 big losses" of TPM into one number that represents the effective operating rate for a piece of equipment or synchronized line—in other words, the percent of time the equipment or line is operating effectively, or its valuable operating time. That translates to the percentage of product produced compared to what could have been produced in the scheduled time. Click here for Source
| Availability (downtime) | 1. Equipment failure (breakdowns) |
| 2. Setup and adjustment | |
| Performance (speed) | 3. Idling and minor stoppages |
| 4. Reduced speed of operation | |
| Quality (defects) | 5. Process defects (scrap, repairs) |
| 6. Reduced yield (from startup to stable production) |
ShopFloorManager's ShopFloorMonitoring includes many different monitoring Programs including 5 basic OEE related programs. See the list of programs below.
Note: See ShopFloorManager's User Manual for more details.
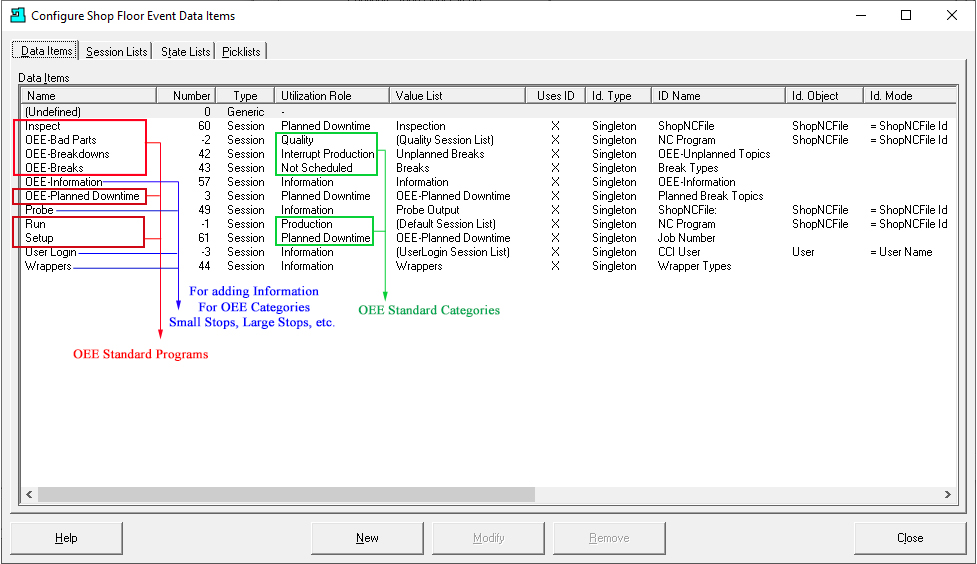
The programs Probe & Wrapper are used for gathering Non OEE Information and can be extended by the User to add additional categories for investigating intra cycle times, probe measurements & other events.
OEE-Categories not displayed above are "Small Stops" & "Large Stops". These Categories are automatically assigned Times as follows:
"OEE-Bad Parts" is a Quantity Category to record Scrapped or Reworked Parts. This doesn't have to be entered when an Event happens but when it is convenient for the User! If entered after the event, say at inspection, the Date/Times entered by a User for this Category are configurable and allow a User to select a date/time before the present! This is the Category OEE Quality !
"OEE-Breakdowns" Times when an unscheduled event interrupts production. This could be Machine Failure, No Material, Tooling Problem, etc. . OEE-Breakdowns Category is calculated as an Interrupt Production Category.
"OEE-Breaks (Not Scheduled)" Times when Production is not planned such as: Coffee Breaks, Lunch Breaks, Non-Shifts (2nd and or 3rd), Weekends, etc.! This Category is not used in the TEEP calculations but is used in OOE & OEE calculations! OEE-Breaks is calculated as a Not Scheduled Category.
"OEE-Information" doesn't have to be entered when an Event happens but when it is convenient for the User! The Date/Times entered by a User for this Category are configurable and allow a User to select a date/time before the present where this is not allowed by other Categories!
"OEE-Planned Downtime" Times when a scheduled event interrupts production. This could be Machine Maintenance, Training, Company Meeting, etc. OEE-Planned Downtime is calculated as an Interrupt Production Category.
"Small Stops", Idle Times, don't realistically provide for Real-Time entry by Users because of the short duration of these Events! These generally happen between machine cycles. ShopFloorMonitoring captures and assigns these to the OEE category Small Stops and is calculated as an Interrupt Production Category.
"Large Stops" is automatically assign by ShopFloorMonitoring for Idle Times over 3 minutes that have not been assigned to any OEE-Category by a User. These times could happen between cycles which could indicate something more then transitioning from one cycle to another especially if they are longer than 5-6 minutes. Large Stops is calculated as an Interrupt Production Category.
"Wrapper" is an Informational Category used inside ShopNCFiles to "Wrap" sections of code for collecting data including code markers, code time execution, notifying, Emailing, users when sections of codes are being executed, etc. Wrapper is calculated as an OEE-Information Category.
"Probe" is an Informational Category for collecting probe measurements & other pertinent data while executing a ShopNCFile! This template can be extended by a User to meet their particular requirements! Probe is calculated as an OEE-Information Category.
"Run" is a default Production Category for collecting Start & End Macros while executing a ShopNCFile! Run is calculated as an OEE-Production Category.
"Inspect" is a default Planned Downtime Category for collecting Inspection Data using ShopFloorMDI or an OEE-Controller base MDI.
"Setup" is a default Planned Downtime Category for collecting Setup Data using ShopFloorMDI or an OEE-Controller base MDI.
"User Login" is an Informational Category for collecting User Logins & Logouts initiated from ShopFloorMDI or an OEE-Controller base MDI.
Notes:
Using OEE to discover your Hidden Machines
The mystery of the hidden machine
Believe it or not, in most factories every single machine operates alongside an identical hidden machine. The art is to make this hidden machine visible and to use it. This book offers you the key with which to do just that.
Perhaps your initial response is: I’m not buying that, surely we’re not crazy? No, of course not! In fact, you have been successful so far; after all, you are still in business, and hopefully you are turning a profit and will still be in business next year, too.
But the fact remains: you do not see what you do not pay attention to. How many lampposts did you see this morning on your way to work? Where were they? What did the look like? How many different kinds did you see? Were all of them working? Imagine that you are taking a “lamppost class” today. Want to bet that all of a sudden you will start seeing lampposts everywhere?
But we are not here for a class on lampposts: we are here to learn about “hidden Machines”. Want to bet that all of a sudden you will start seeing production capacity everywhere, just waiting to be utilized? Let’s get Started!

Credit: From the Book OEE for The Production Team by Aron Koch and motivated by Seiichhi Nakajima the inventor of TPM & OEE during the 1960s.
With ShopFloorMonitoring, our assistance and using this book as your guide, you and your Production Team can achieve your OEE, OOE & TEEP Goals!
Insertion of DPRNTs & Downloading of RRC Files Supports Calculating OEE Effectiveness
While using ShopDNC to queue ShopNCFiles an Operator can select multiple options for downloading or accept the default settings. Usually the default settings are configured for the unique Remote Request requirements for each CNC! See the queuing form below:
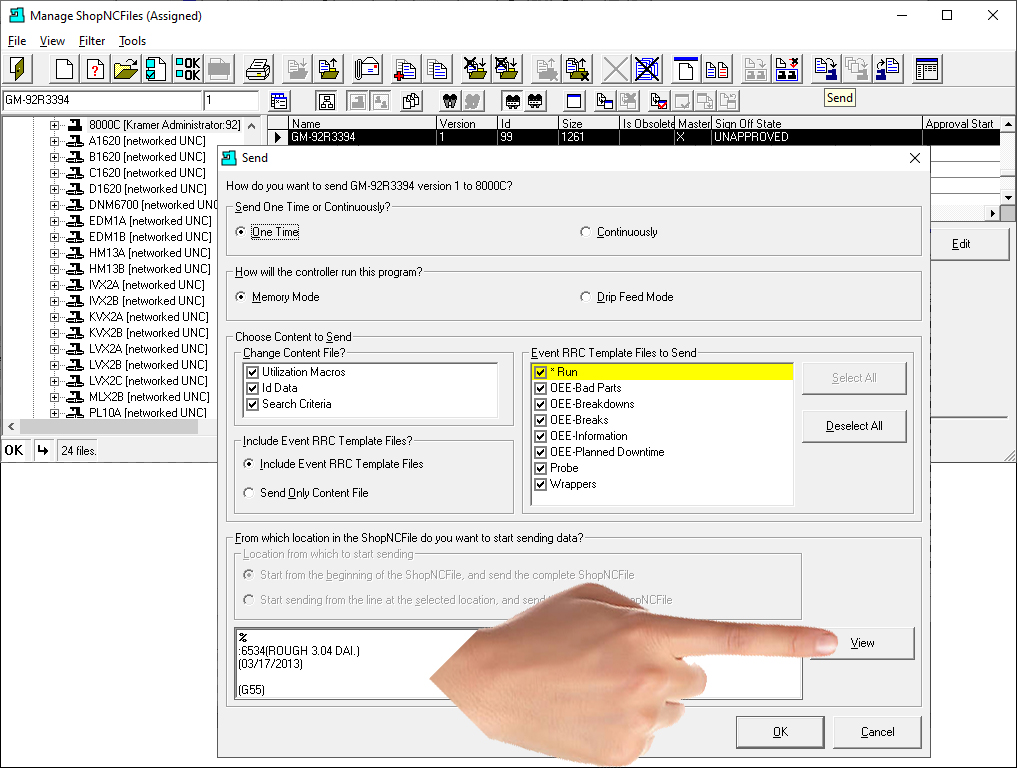
During ShopDNC Queuing Process an Operator can select Downloading Options to include Utilization Macros (DPRNTs auto inserted in ShopNCFile), the ID Data, the Search Criteria and any number of Event RRC Templates for use in the OEE-Controller-based-MDI as displayed above.
Note: Select the Navigation Menu: MDI Apps/OEE-MDI for RRC Template details. Whenever a ShopNCFile is downloaded all of the above information is updated to the latest version guaranteed!
Let's click on the View Button to see what is inserted in the ShopNCFile based on the chosen Options.
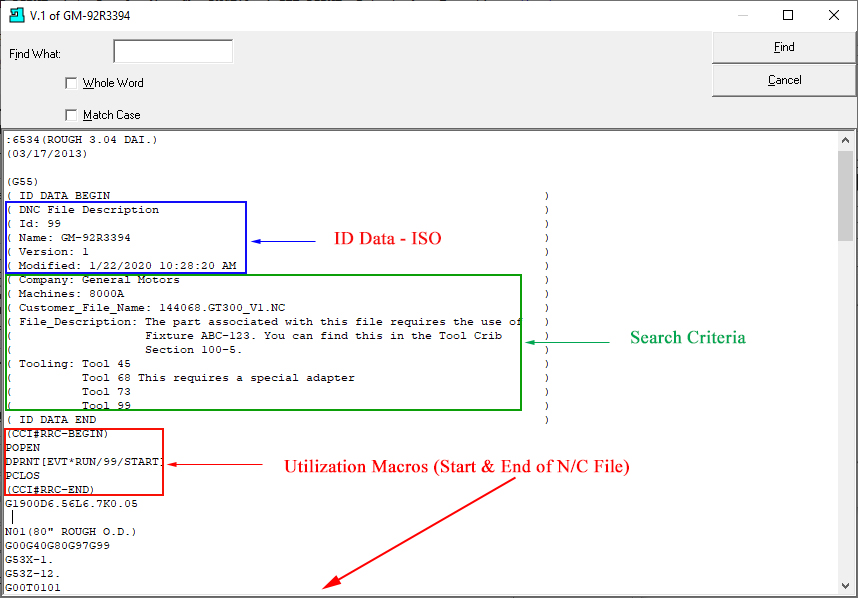
There are four sections of the above View Form we will discuss. The fourth section is at the end of the ShopNCFile! We will explain.
Note: Click on this link OEE-Controller-based-MDI to View a Typical Template.
The App Users use to Collect Important OEE Data
It has been determined that one of the best approaches for improving Overall Machine Effectiveness on the Shop Floor is to collect and analyze TEEP, OOE, OEE & Performance Data. ShopFloorMDI is one method for accomplishing this objective!
ShopFloorMDI is an Application that executes ShopFloorMonitoring Programs for manually entering Event Information (Usually Non-Production ShopFloor Events) that are relevant to the Production Process when other collection methods are less effective or not available. Select the Menu "MDI Apps" and select "OEE-Controller based MDI" for details!
Any Events Input & Generated by ShopFloorMDI will reflect the present status of Quality, Production, Efficiency, Machine Effectiveness, Performance, Maintenance, Material Handling, etc.
Event Information entered into ShopFloorMDI is displayed in real-time via the Machine Status Window, ShopFloorCharts & ShopFloorReports, ShopFloorReports: Configurations, etc. reflecting the real-time production status of your shop.
Any ShopFloorMonitoring Programs created using ShopFloorMonitoring can be executed by ShopFloorMDI. ShopFloorMonitoring Programs are customer created reflecting the actual needs of a particular manufacturing facility not a pre-configured program based on pre-supposed needs of companies.
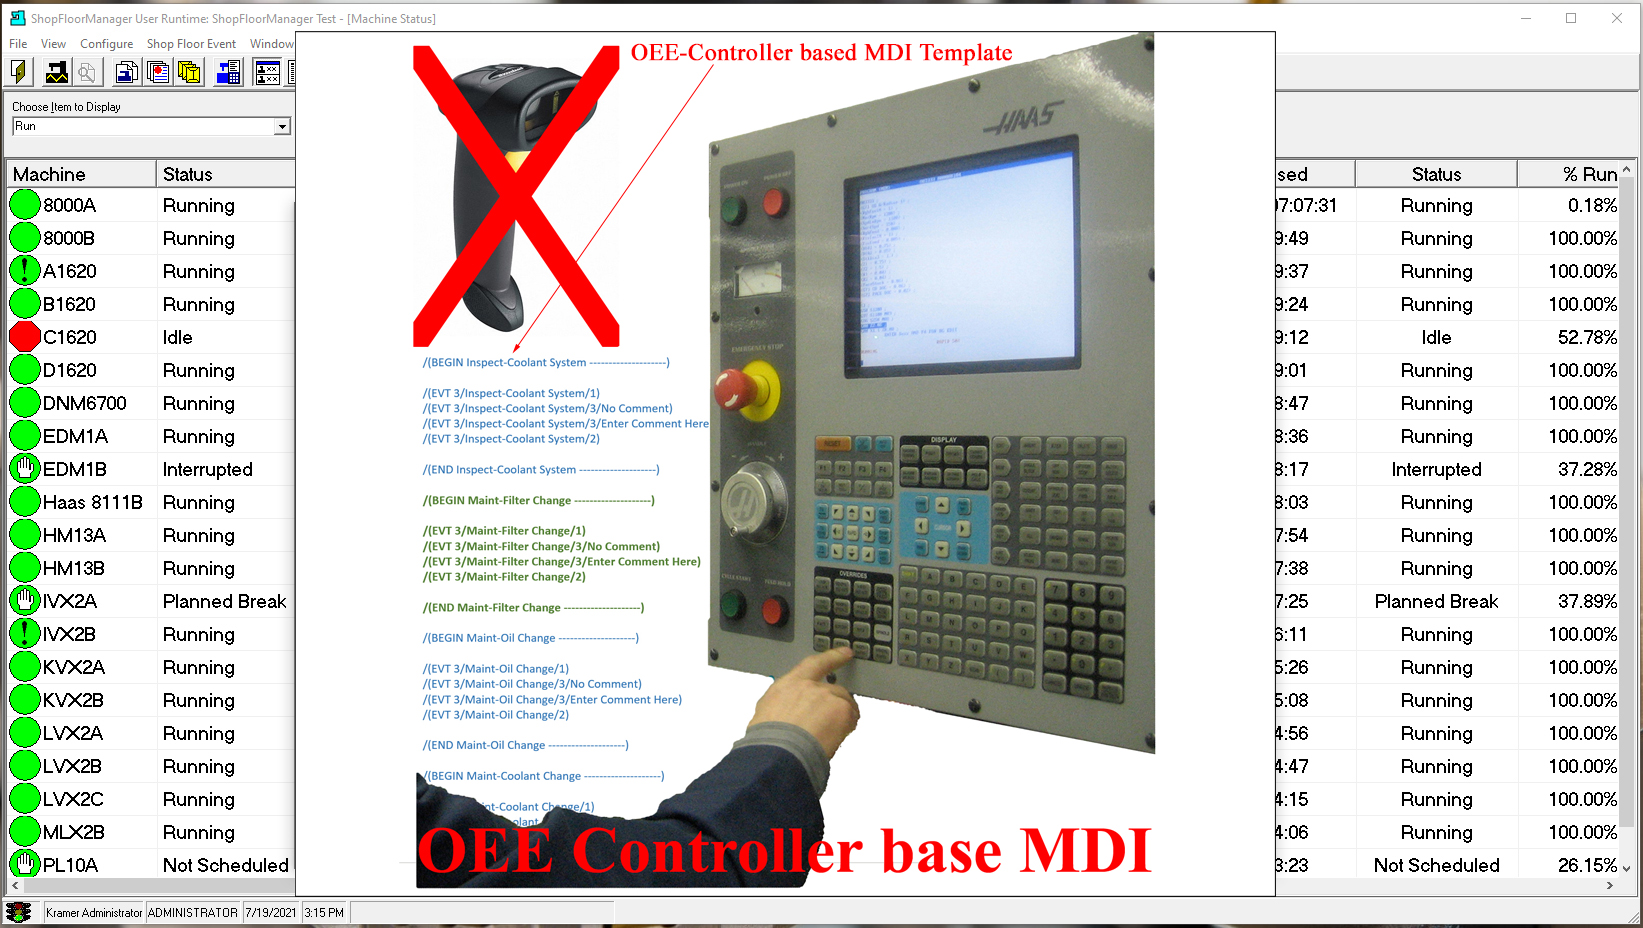
ShopFloorMonitoring also supports an alternative method for submitting OEE type data. When downloading ShopNCFiles to a CNC, ShopFloorMonitoring can generate "OEE-Controller base MDI" (RRC Templates) Files that can be downloaded at the same time.
"OEE-Controller base MDI" Files contains all of the Events that can be output by ShopFloorMDI and were designed so Controllers can easily output these Events without Scanners!
Select the Menu "MDI Apps" and the "OEE-Controller based MDI" Section for details regarding this entry method.
Note: 99% of the times this entry method can be used instead of ShopFloorMDI.
ShopFloorMDI supports all data entry paradigms!
You don't need Scanners or Additional Hardware only your Controller
It has been determined that one of the best approaches for improving Overall Machine Effectiveness on the Shop Floor is to collect and analyze TEEP, OOE & OEE Data.
The standard procedure to collect OEE Type Data is to use scanners, Data Collection Software using PCs & associated hardware at each piece of equipment or in close proximity if being shared. Using Scanners leads to additional Operator training, more paper work in an Operator’s Area, and more associated hardware clutter, Just what an Operator needs!
Using a Machine’s Controller and an Operator’s base controller knowledge they can accomplish collecting OEE Data without scanners, PCs, data collection software, etc.
ShopFloorManager uses the synergies of a Machine Controller, the Operator’s Controller knowledge and an "OEE-Controller-base-MDI" File (RRC Template) to enter OEE data! When we say "OEE-Controller-base-MDI" File we are inferring using a Machine Tool Controller and a N/C like File for outputting (uploading) OEE Data directly to ShopFloorMonitoring.
This approach doesn’t require purchasing scanners, minimizes Operator Training, minimizes scanner Clutter, minimizes additional paper work and eliminates the cost of installing Scanners in the Operator’s Work Areas. Think about that, no Scanner Costs, no installation costs, no Scanner Clutter, reduced Paper Clutter and virtually no Training!
Better yet as an Operator downloads an ShopNCFile they can selected "OEE-Controller based MDI" Files from a list of monitoring programs which are Automatically generated during downloading.
All an Operator needs to do to use these programs is to select an appropriate "OEE-Controller based MDI" File, modify a few characters and Upload! That's all the Operator has to do to input the critical OEE Data needed to improve Machine Effectiveness & Efficiencies! No Scanners Required!
The ShopFloorMonitoring Portal into your Production Status
The Machine Status Window is the Portal into ShopFloorMonitoring's Active Machine Monitoring! Machine Status provides a Real-Time View of all configured Machines' Production Status on the Shopfloor.
The Monitoring Events driving these Views are generated via DPRINTs Inserted into ShopNCFile Programs and output to ShopFloorMonitoring as the ShopNCFile executes. These Events can be simultaneously generated via ShopFloorMDI and "OEE-Controller-based-MDI" base Files when these provide a better Input Method!
These Output DPRNT Events are captured by ShopFloorMonitoring and used to update the Machine Status Window, ShopFloorCharts & ShopFloorReports while simultaneously storing these in ShopFloorMonitoring’s Database. These Events are then available for generating 16 different on-the-fly ShopFloorReports and three additional real-time ShopFloorCharts all uniquely defined using the ShopReport Filter!
The Machine Status Window supports 10 Ranking Icons representing different Production States for each Machine changing in Real-Time to indicate the Present Production State while implicitly indicating what corrective Steps to take next! These Icons provide the visual indicators of whether you need to act now, be aware of possible production problems in the near future or are under control at this moment!
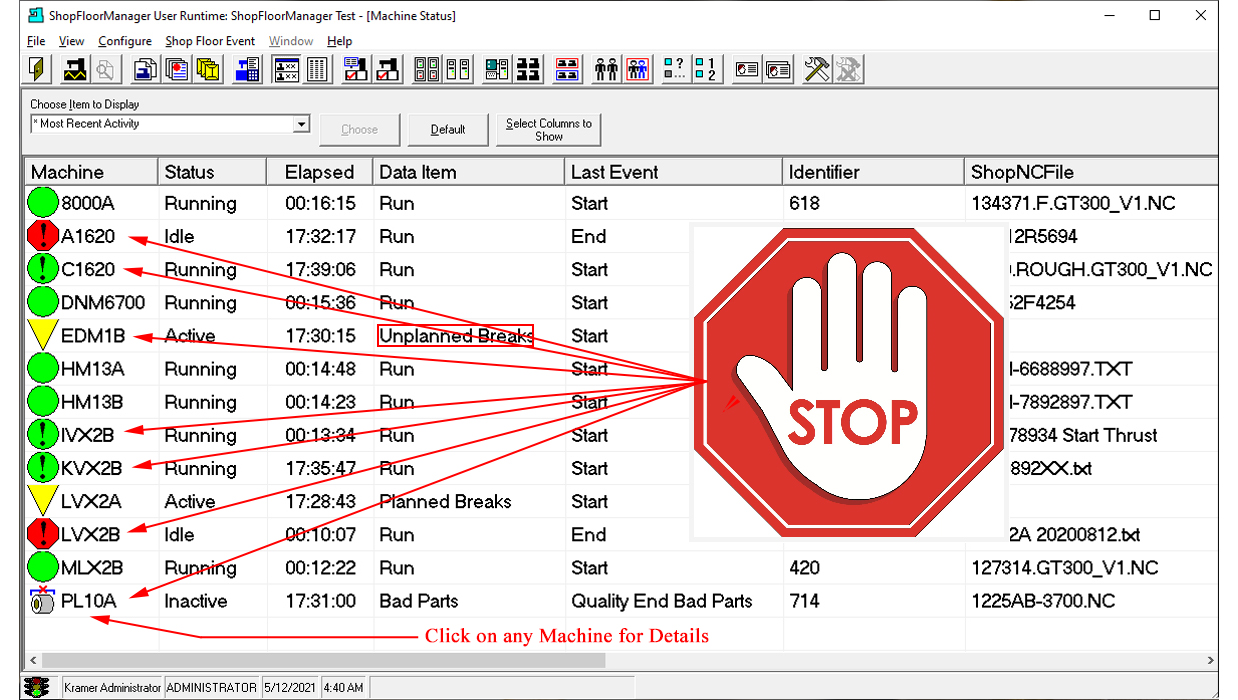
The Machine Status Window is the Shopfloor Stop Sign for locating Shopfloor Production Status! STOP, LOOK & Click! Heed it's Warnings and increase your Machine Effectiveness!
Real-Time Visuals that Drive Machine Effectiveness, Efficiency & Quality
ShopFloorCharts is suite of three interactive charts that presents real-time Visuals of any machine's production: TEEP, OOE, OEE. Performance and Informational Events on the ShopFloor.
Once ShopFloorCharts have been activated, they display real-time Production Status indicating what is happening at any Machine on the ShopFloor! You don’t have to run to the Shop for details! Just choose, click and interrogate any ShopChart Event and the details are displayed in the right-hand Pane!
Note: To investigate the different ShopFloorCharts click on the small images below the main image!
Machine 1-Day History Chart

Machine 1-Day Detailed History Chart

Machine 7-Day History Chart
Look at the Data your Way!
Anybody can create Reports that just play back the Events as they were captured. Filtering through masses of data to corollate this data into a useful Report is the real challenge!
ShopReport Filter was designed to sift through countless months of Event Data using configured Dates & Times, Machines, Monitoring Programs, Specific Events, Users, Macro data including Macro Variables, etc. to locate, compartmentalize & correlate this data into meaningful Presentations-ShopFloorReports.
The ShopReport Filter can be configured so every useful property of the collected Production Events can be used to generated ShopFloorReports that provide the ability to search for general & specific Production Data of interest.
ShopReport Filter will find these "Needles(Events) in any Haystacks" no matter if they are hiding in "Plain-Sight" or stashed away in hidden Haystacks created months ago! They will be found and structured so you have immediate access to any Events indicating Systemic or Temporal Production Issues!
If you need to tweak any ShopReport you can accomplish this in minutes by making on-the-fly changes to ShopReport Filter and in seconds and regenerate any ShopReport so you can continue to narrow down the criteria for finding those Needles in the Haystacks!
ShopReport Filter was designed to be used with any program created using ShopFloorMonitoring including the categories of TEEP, OOE, OEE, Performance and any other program created by ShopFloorMonitoring.
Note: You can save the present ShopReport Filter Settings with a unique Name so in the future you can just Choose & Click to generate Reports!
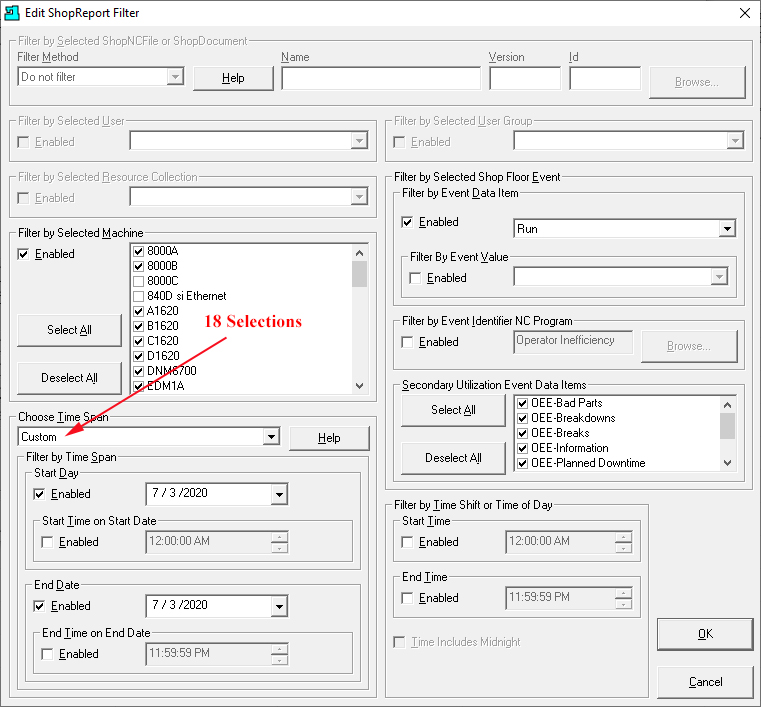
In the above Graphic you can see the various Properties that can be configure with ShopReport Filter?
Where Data Reveals it's Secrets
ShopFloorReports play an important Role in locating any and all Production Events that may not meet your company's standards. There are 16 base ShopFloorReports that are designed to present Event data in specific formats to aid in locating Production Problems. These base ShopFloorReports do most of the base mining for you and all you need to do is tweak & complete.
To enhance these base ShopFloorReports you can use the configurable ShopReport Filter. This will allow you to quickly tweak and regenerate these ShopFloorReports in minutes to better format and locate all the specific Events of interest: Breakdowns, Setup, Short Times, Long Times, Reduced Speed, Process Defects, Reduced Yield, etc.!
ShopFloorReports is specifically designed to optimize collecting and reporting of TEEP, OOE, OEE & Performance Standards. Using these ShopFloorReports in conjunction with the Machine Status Window & ShopFloorCharts will provide Real-Time, In-Time & Historical Details that allow for searching for systemic and temporal Production Issues.
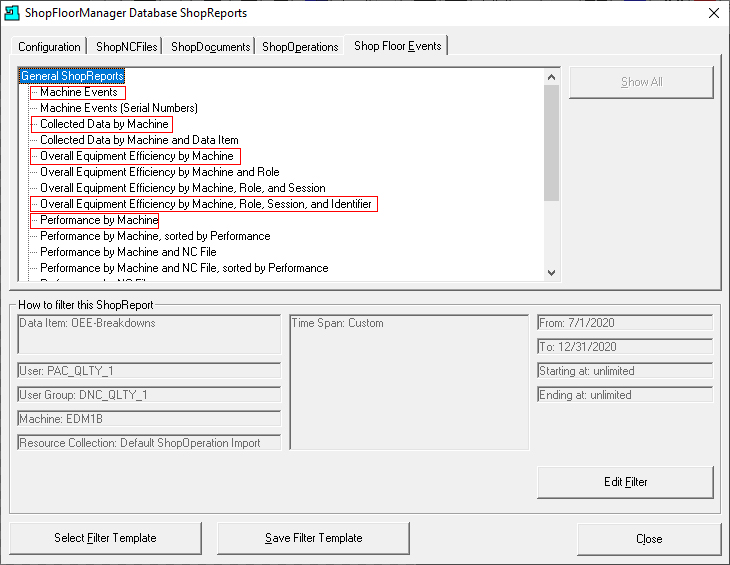
Let's take a quick look at the "OEE by Machine & Role" PDF ShopReport using the Search String "Machine:" with the Case Sensitive Setting.
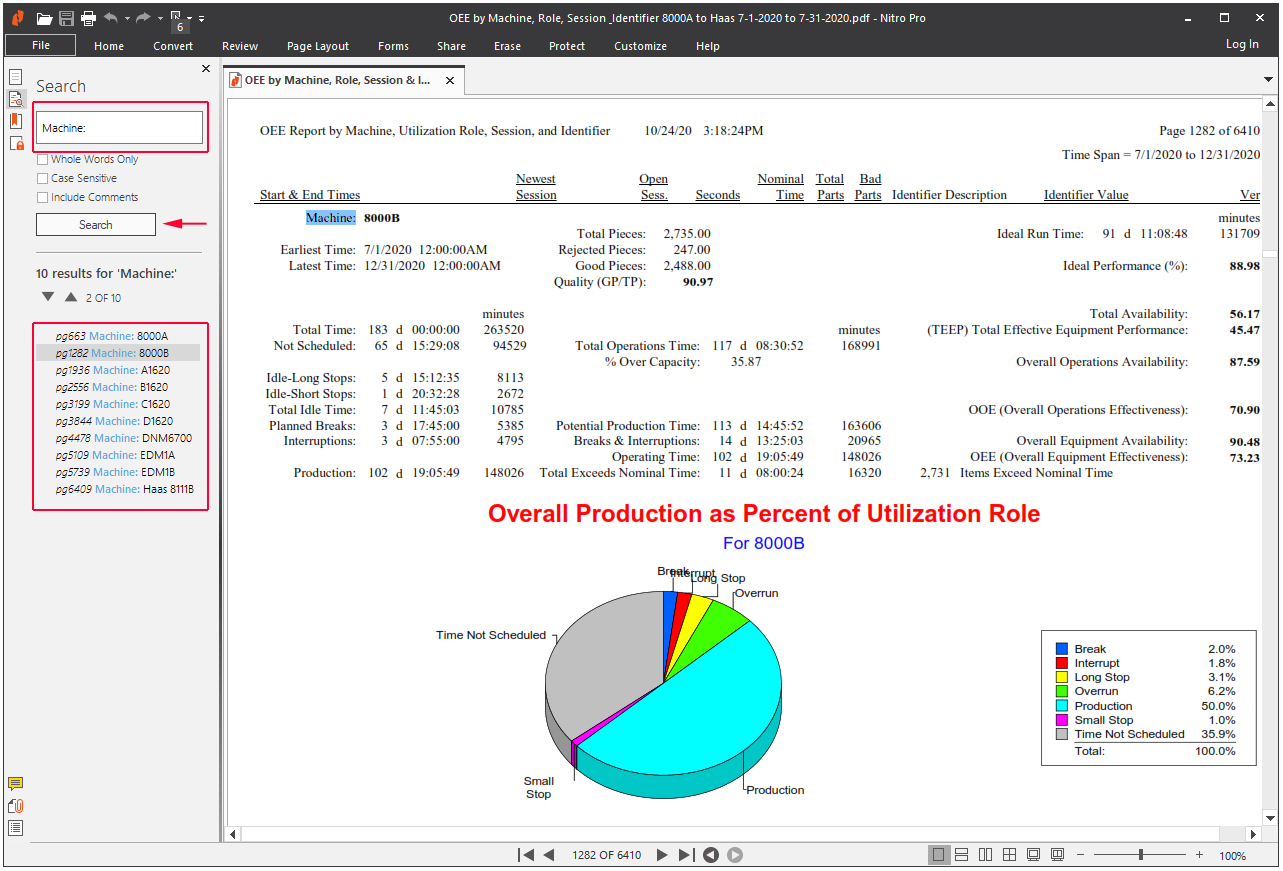
You don't have to sift through this ShopRepot to located the individual TEEP, OOE & OEE Calculations for each of the 10 Machines! By using the Search capabilities of this PDF ShopReport with the Search string "Machine:" a List of Search Results for each of the Machines' Calculations are displayed. All you need to then is click on any of the List Results and the OEE Calculations are displayed!
Note the Key Word: "Machine:" was entered in the Search Text Box. (See the Red Arrows & Rectangle for Reference) and the Search Results are displayed in the Search List!
This capability is present in each of the PDF ShopFloorReports. Any Key Word in the ShopReport can be Searched for and located!
Using ShopFloorMonitoring Effectively.
How do we Effectively use all the ShopFloorMonitoring Tools to improve Machine Effectiveness, Production Efficiencies, Asset Usage, Quality, Customer Satisfaction and to Reduce Costs?
Our Goal is to use these tools logically to find all potential Production Problems quickly and pinpoint the specific TEEP, OOE, OEE & Performance Problem Indicators so you can move quickly to rectify these Problems!
As you are working the first step in using the "Visual to Digital Hierarchy Steps Approach" is to occasionally scan the "Machine Status Window" for Telltale Icons that indicate Production Problems.
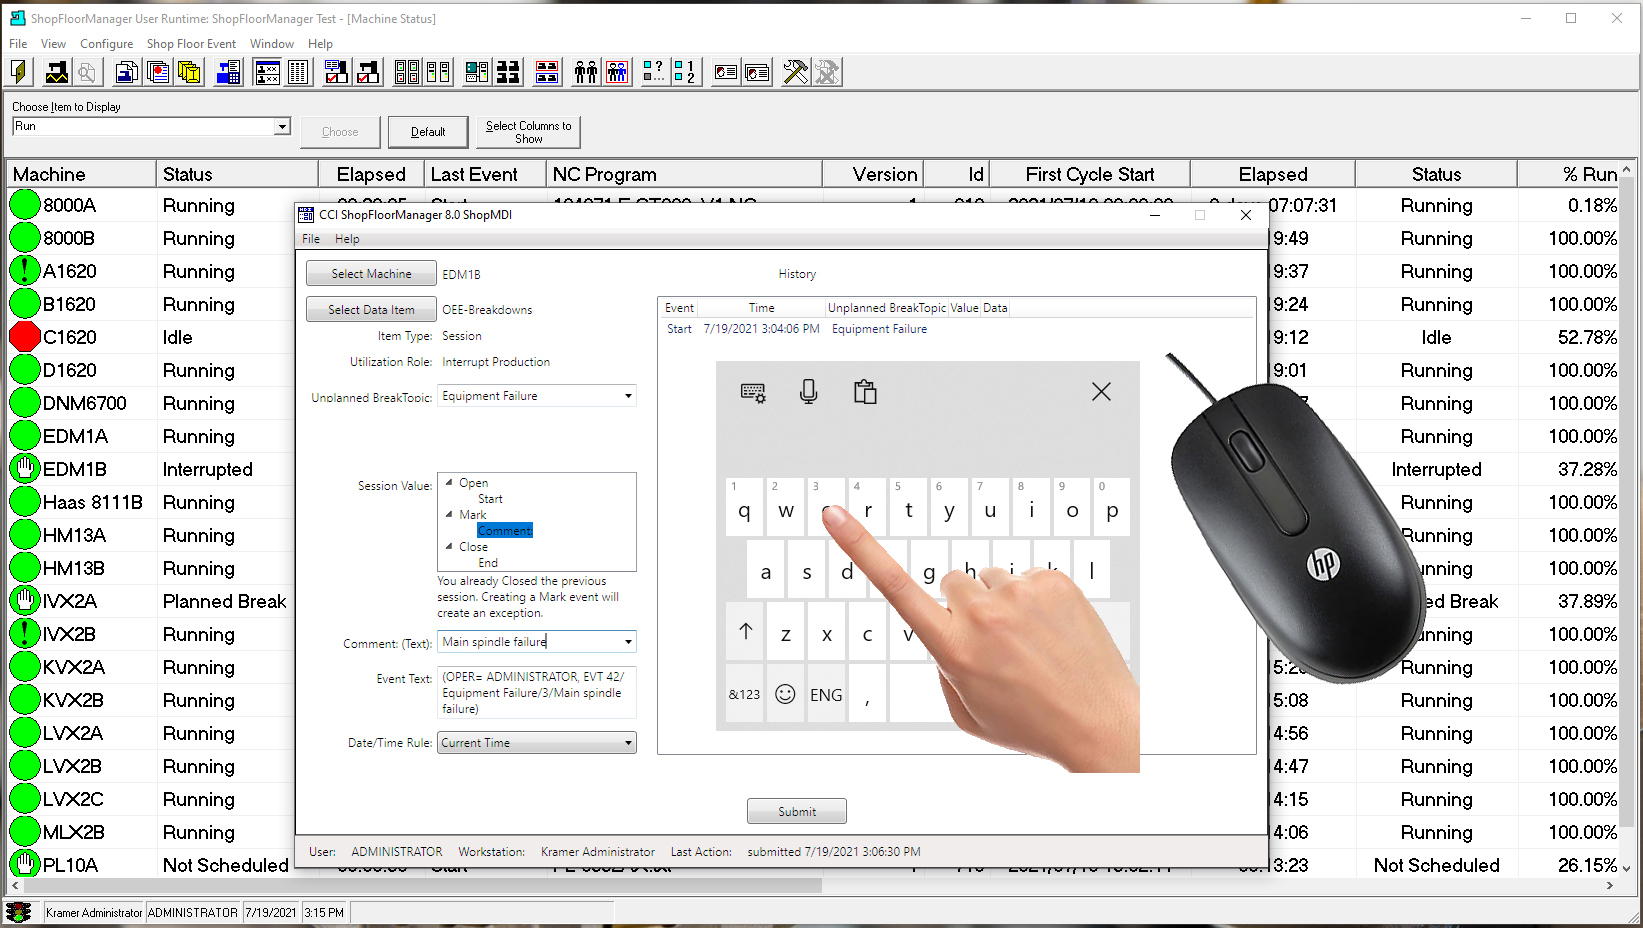
For this Demo we will be concentrating on machine EDM1B. The Telltale Icon  indicates that Machine EDM1B has paused due to
a "Unplanned Breaks"! This category is a Sub-Category, Session, of the OEE "Interrupt Production" Category!
indicates that Machine EDM1B has paused due to
a "Unplanned Breaks"! This category is a Sub-Category, Session, of the OEE "Interrupt Production" Category!
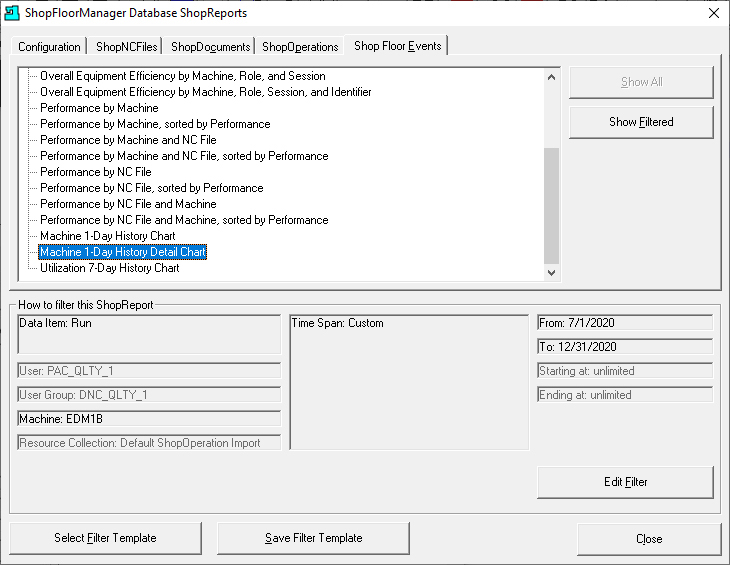
Click on the EDM1B Icon and you will immediately be brought to the "ShopFloorManager Database
ShopFloorReports" Window.

Highlighted the ShopFloorCharts "Machine 1-Day History Detail Chart". Click on the Edit Filter Button and the following Window will be displayed:
Note: We are assuming that the "Machine 1-Day History Detail Chart" is not presently Active! This is usually the case unless you were presently monitoring this Machine for all the Individual Events separated into Event Categories!
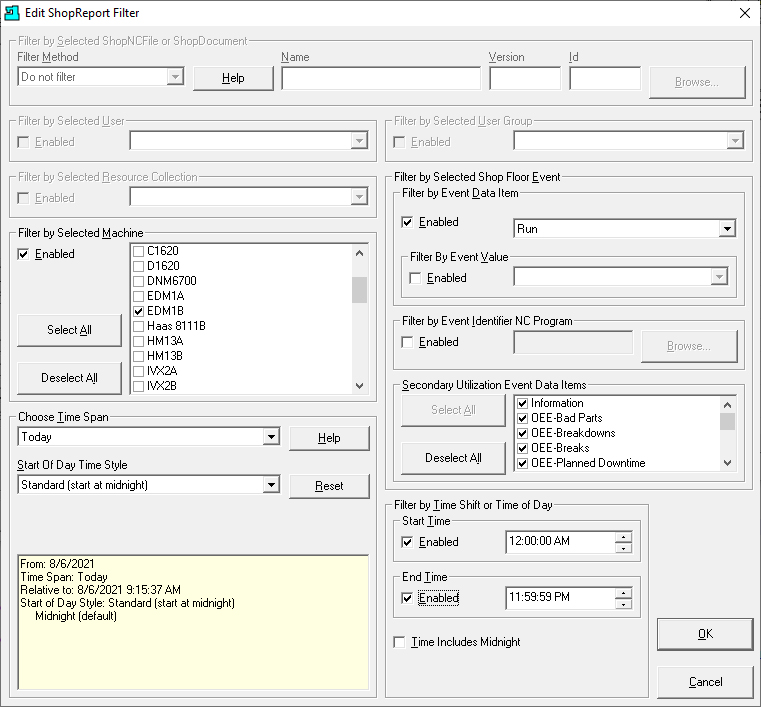
The Machine EDM1B has automatically been selected! Make any necessary changes in the ShopReport Filter, see the User Manual, and click the OK Button.
Note: Until you use the ShopReport Filter a few times select the options shown! You will quickly learn to select the options that best meet your needs!
This form has been updated reflecting the changes made in the ShopReport Filter! Make sure that the "Machine 1-Day History Detail Chart" is still highlighted!
Click on the "Show Filtered" Button and the ShopChart "Machine 1-Day History Detail Chart" is displayed!
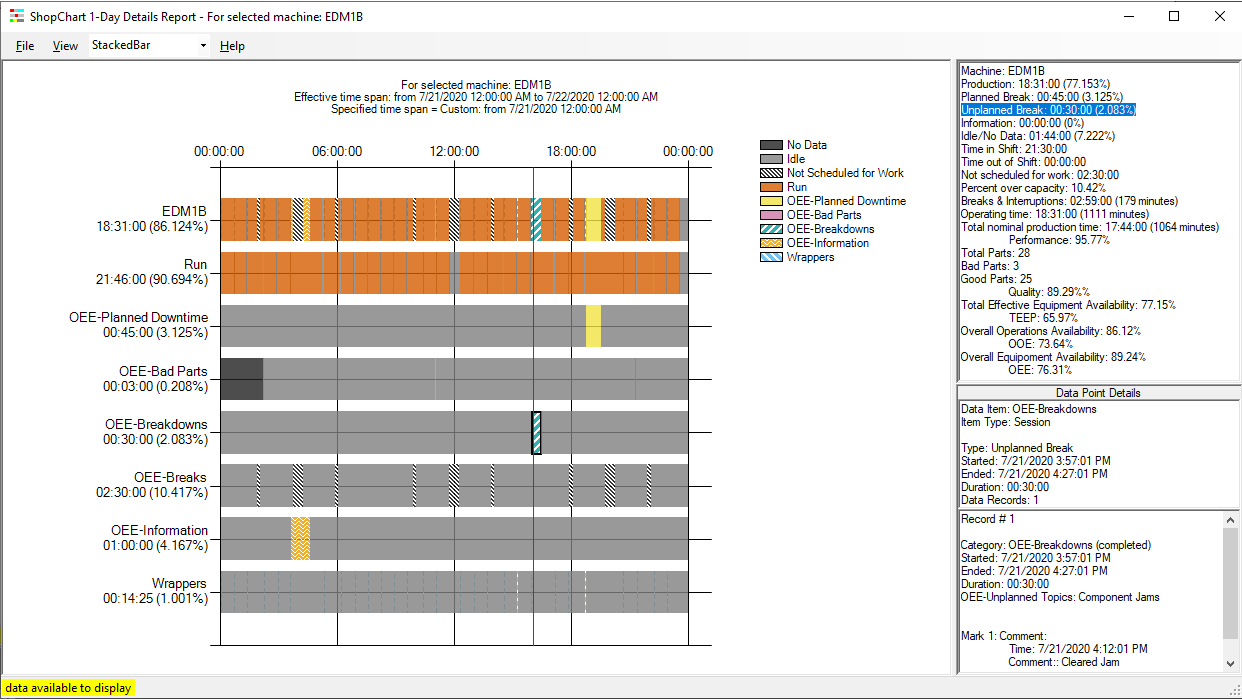
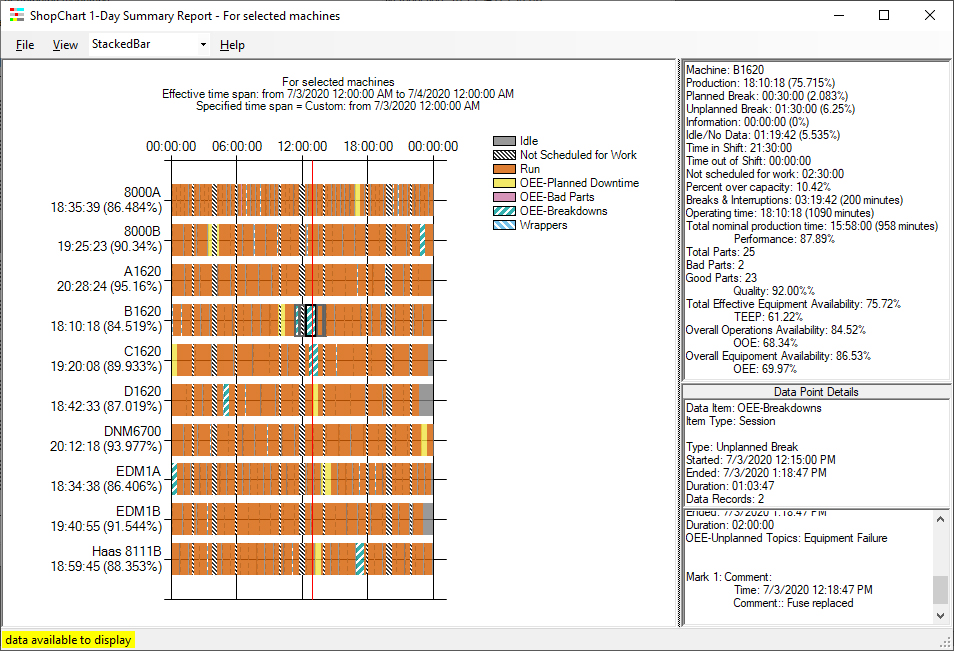
This ShopChart displays one Days' Events for this Machine. This is very useful when you want to keep a close eye on possible production problem areas or perhaps a special Job and need immediate visual feedback for progress or Problems!
To investigate if there are "Unplanned Breaks" (Interrupt Production) let's zoom in on the Upper-Right-Hand Pane and look at the "Unplanned Breaks" percent for this day highlighted in Blue!
It is presently at 2.803% which seems a bit high! To see if this is just one-time incident let's look at the Utilization 7-Day Chart for this Machine!
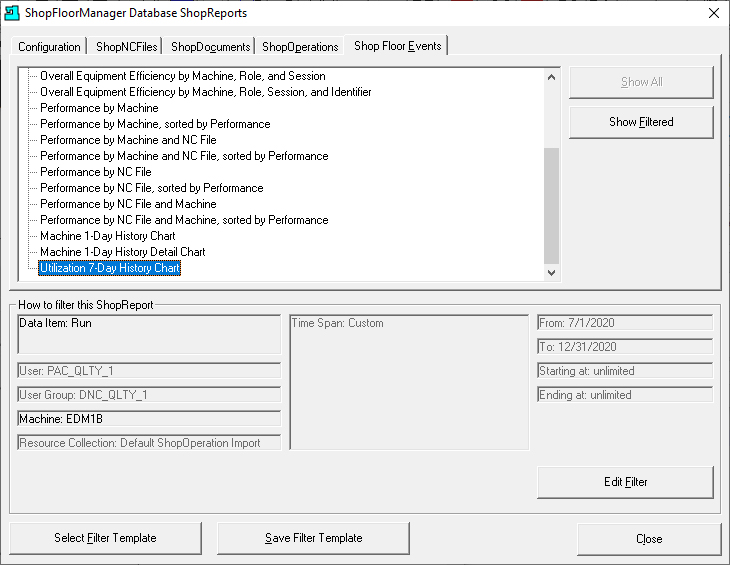
Highlight the "Utilization 7-Day History Chart" and click on the "Show Filtered" Button.
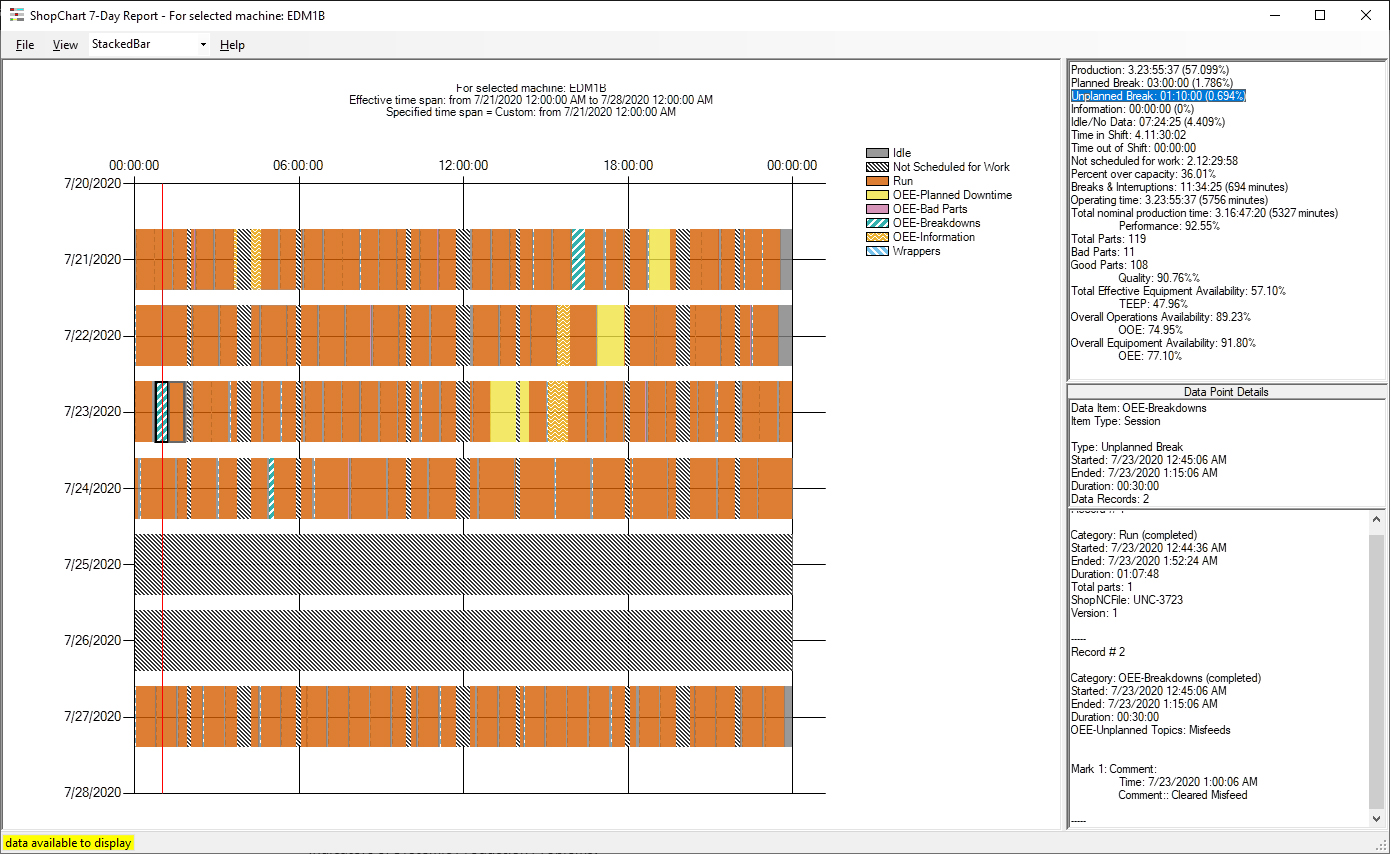
This ShopChart displays 7 Days of Events for this Machine. This ShopChart is helpful when you are looking for indicators of Systemic Production Problems!
To investigate if these "Unplanned Breaks" are out of performance specification let's zoom in on the Upper-Right-Hand Pane and look at the Unplanned Breaks daily percent highlighted in Blue!
It is presently at .694% which is much Less than the previous ShopChart "Machine 1-Day History Detail Chart"!
Even though this suggests we don't need to dig deeper let's explore as if it were a Systemic Problem! The General Approach to use is to establish a reasonable time frame to seach for systemic problems, let's say 6 months for this demonstration.
Now let's generate 5 ShopFloorReports as indicated below using the present ShopReport Filter settings and search each of these ShopFloorReports with specific Search Phrases that address your areas of concern. See the Following PDF ShopFloorReports!
Open all of the above PDF Reports in the RED Rectangles keeping them in one PDF Viewer which will reduce clutter and confusion & provide a platform for digging into the OEE Data to expose systemic or problematic Machine-Production problems! See the User Manual for converting native ShopReport into PDFs on the fly. PDFs provide search capabilities not present in the native ShopFloorReports.
The following approach is one way to quickly find questionably OEE Data that may be systemic or at least problematic! As you gain experience using these tools you will find better ways to mine this data and expose any problems quickly!
We will use one of many approaches to mine OEE Data which should suggest other ways for locating problematic OEE Data! Even though this approach will work in most manufacturing facilities it can be modified for using different approaches! The tools we provide will allow you to mine the data the way you feel is best!
As you can see above we have opened & aligned the 5 ShopFloorReports in a particular order which we find works for us. This order is not set in stone as you may find that another sequence or any sequence works!
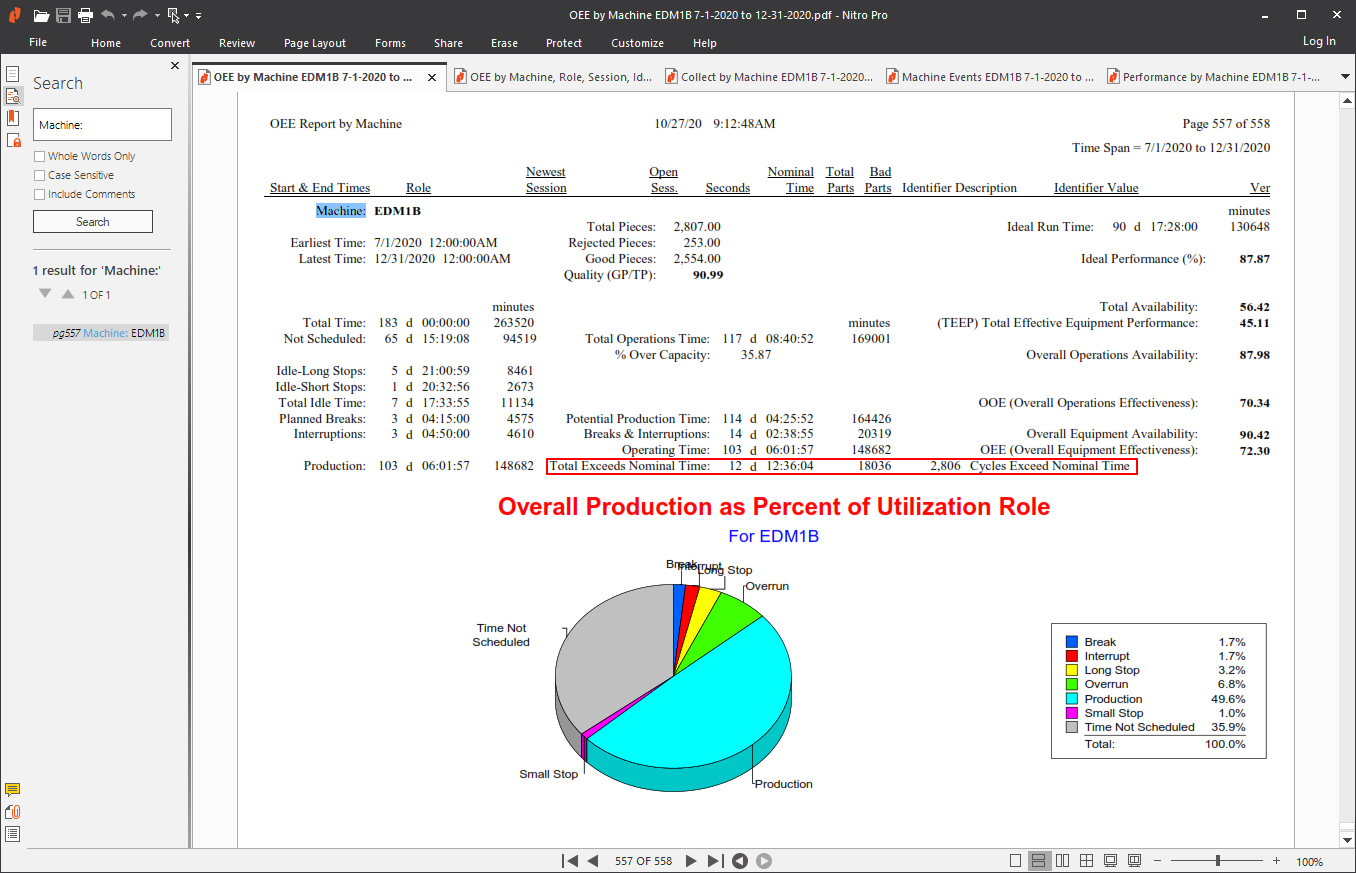
The First ShopReport, OEE by Machine, provides the fundamental TEEP, OOE, OEE & Performance calculations which provide the bases of all "Searches"! In other words the Calculation Values suggest which Roles should be Searched First! Using our approach this PDF's page should not be realigned or the page selection changed.
This ShopReport provides the fundamental calculations which we will often be visiting. So whenever a User needs to reference this fundamental OEE data all they need to do is click the first tab on the PDF Viewer.
Initially, to make any sense out of the OEE Calculations you need to have some base data which will require you to collect data for at least a couple of weeks. In any case this should not stop you starting the analysis process after collecting data for a day or two. At this stage you are in a learning phase! You can't break anything so experiment!
What are the Outgame Goal(s)? In other words how do we use TEEP, OOE, OEE & Performance to improve Machine Effectiveness including Performance? The real value is to provide an initial base "Measurement" to compare against future "Measurements" which will indicate improvements, complacency or regression. We use the improvements-complacency-regressions calculations in the following OEE Categories to meet the Outgame Goal(s): Steady Periodic Improvements in all OEE Categories & Performance!
This OEE by Machine ShopReport separates OEE Categories into OEE Roles:
This Role breakdown includes the associated Quantitative Role Times spent in each OEE Category. This is an indicator of the order in which Production Problems should be addressed.
Looking at the OEE Pie Chart above the largest segment of Time in one of the Problem Areas is Overrun! Let's see how to use the ShopFloorReports to mine the critical data to use in our analysis!
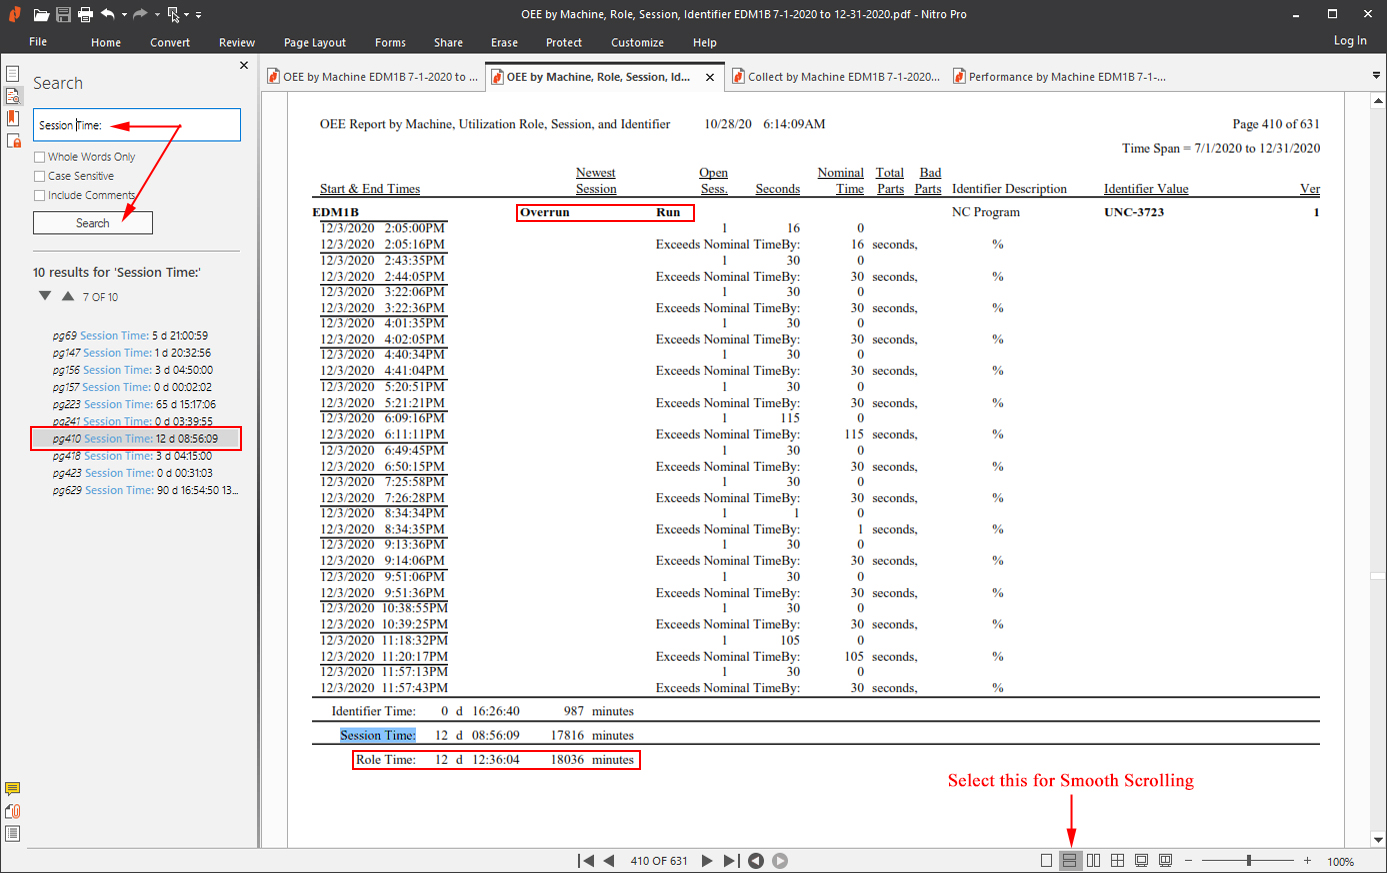
We will first start using the "OEE by Machine, Role, Session & Identifier" ShopReport! Click on this ShopReport Tab and the following is displayed.
Looking at the "OEE By Machine" ShopReport Pie Chart the Overrun Role appears to be the first area we should address!
To accomplish this first selected the ShopReport "OEE by Machine, Role, Session & Identifier" and opened the Search Box, typed in "Session Time:" and click the Search Button displaying the Search Results below the Search Button.
We have selected/clicked the seventh Search Result updating the ShopReport which displays the "Overrun" Role's Results.
Notes:
Now let's find the Overrun Results that are Outliers from the other varying Overrun Values! Click the mouse over the ShopReport and start to scroll backwards using the mouse wheel. Using this method you can scroll through hundreds of records a minute looking for values that are not consistent with the other Outlier Values.
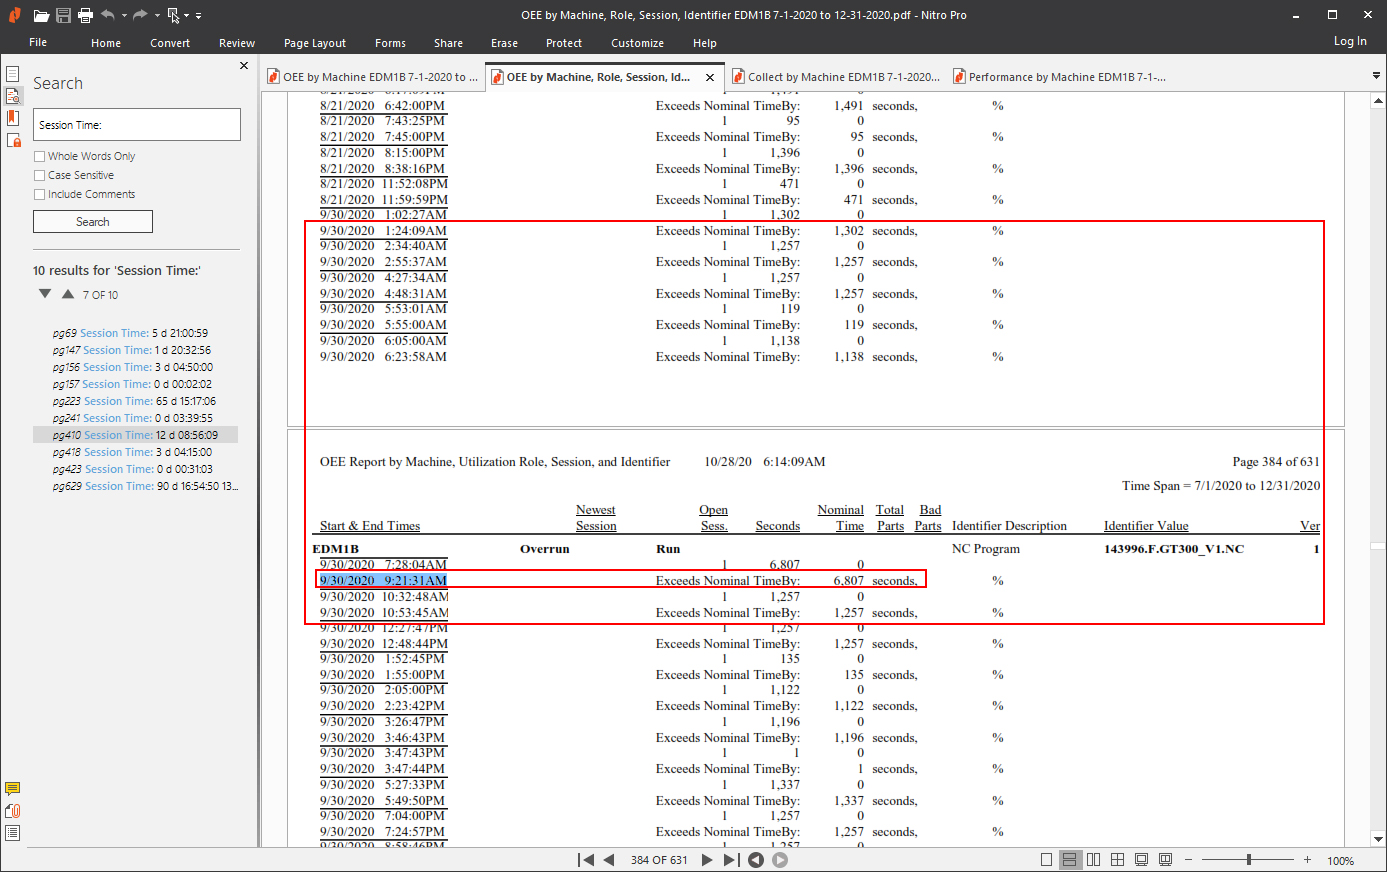
You don't have to recognize the exact value only that it is significantly more than most other Outliers! For this demo we have settled on the Outlier value "6807 Seconds" even though we passed many Outliers but not of this magnitude.
During the scrolling process we encountered multiple Outliers of lesser value. See the Outliers in the Red Rectangle. This view includes what appears to be an Outlier Cluster! Just the kind we would want to investigate!
Next let's dig into the Machine Cycle that this Outlier is associated with to see if we can dig up any other details such as problems with tooling, the machine, etc.! We have copied the date: "9/30/2020 9:21:31AM" from the selected Overrun above which will be used to search for that Machine Cycle in the next ShopReport: "Collect Data by Machine EDM1B PDF".
Also of Importance, if the operator doesn't record the Overrun Reasons as it happens their future recollection more than likely will be foggy making it more difficult to analyzed the results!
Note: ShopFloorManager has an anti-fog solution as it provides two Apps with the ability for operators to record information about Production Events as they happen: ShopFloorMDI & "OEE-Controller-base-MDI". Select the Menu: "MDI Apps" for more details!
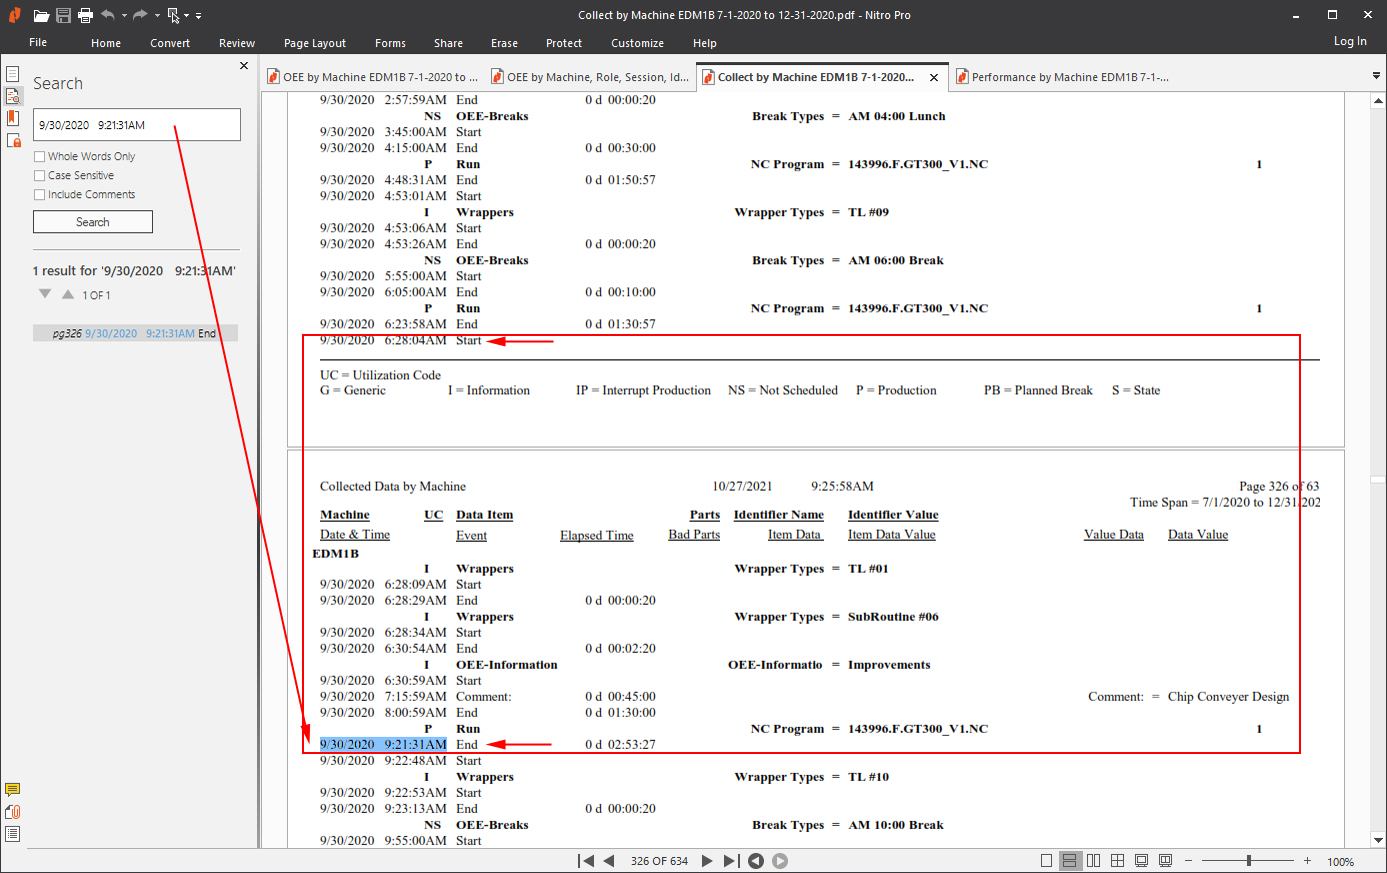
This ShopReport provides complete details on specific Machine Cycles allowing a more comprehensive view of any Problems which in this case looks like a dozen or so!
This Cycle has exceeded the normal cycle time by 6807! This cycle has been enclosed in a Red Rectangle for clarity to emphasize all of the details with associated times as the cycle progresses.
Take a look at the comments which were entered by an operator using one of the MDI Apps! When detailed comments are included analysis becomes easier!
The next ShopReport is explicitly for the performance for every machine cycle including it's Performance %!
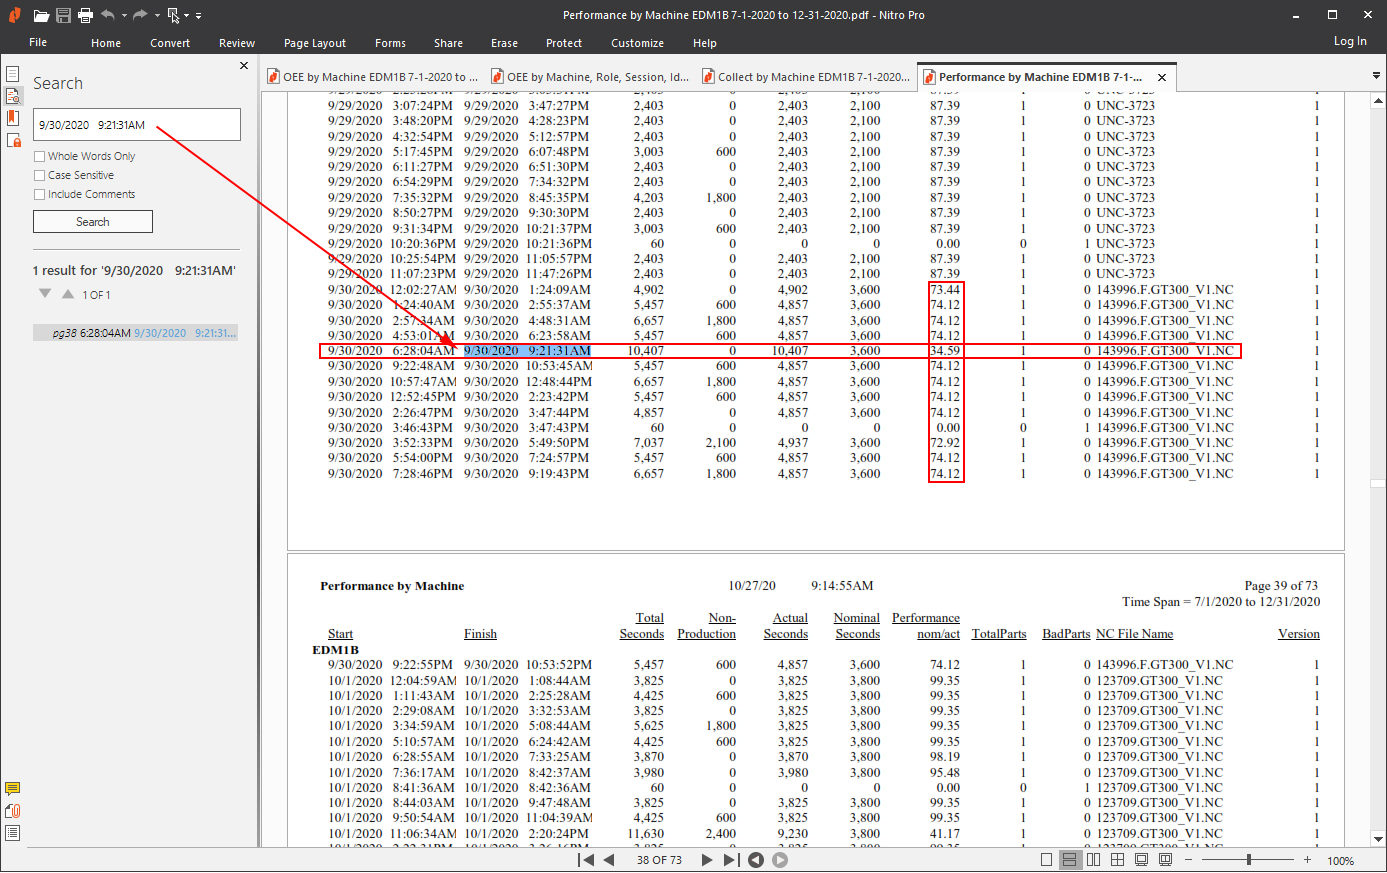
We have copied the time used in the other ShopReport into this ShopFloorReports' Search Box and clicked the Search Button. There was only one result as this ShopReport designates specific times to each Machine Cycle!
When you see this type of Performance for a specific Machine Cycle and for the Machine Cycles around it this is when there may be systemic problems!
This is the result we are looking for when searching for Production Problems. The OEE Holy Grail! As they Say, "Isn't Success Wonderful!
The next ShopReport displays the Raw Machine Events from which all ShopFloorReports, The Machine Status Event & ShopFloorCharts are Generated!
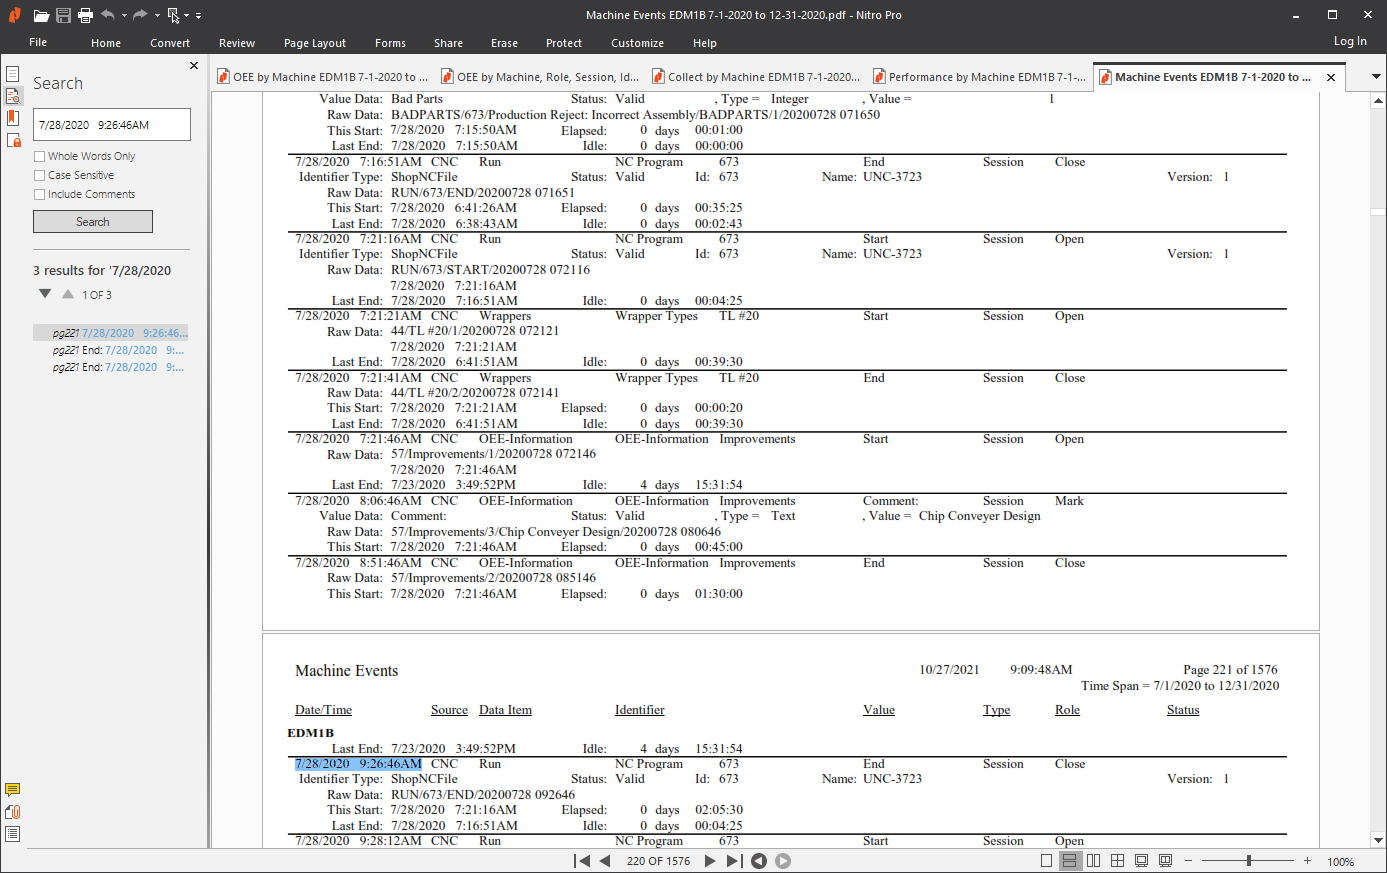
This ShopReport displays the Raw Machine Events that are used to Generate all ShopFloorReports, The Machine Status Window & three real-time ShopFloorCharts!
If it ain't in here it ain't in the ShopFloorReports, ShopFloorCharts or the Machine Status Window! When you have specific questions about Machine Events that aren't answer elsewhere, it is answer here!
Note: The method used above to locate OEE Production Problems is a general approach that will always work but you may find a better Approach. You now have the data is at your finger tips with all the answers! You can now look at every Event in each Machine Cycle and Know the Facts! There will be no wool over your eyes!
When all you have time for is to Push a Button
When all you want to do is setup a few parameters and start Monitoring, ShopFloorMonitoring provides the Answer. You never have to enter any data at all! It's true for the TEEP Category with the following caveats!
ShopFloorMonitoring automatically captures and designates two distinct classes of Interrupt Production data:
Want More for your Money? If you want to put in a little more effort in you can calculate the OOE Category! How so? The OOE Category requires that the "Not Scheduled" Times be included in the OEE-Breaks Data in order perform it's calculations.
How does an Operator accomplish this? An Operator can accomplish this right at their Machine using the Controller to upload a RRC File(OEE-Breaks) pre-configured with the "Not Scheduled" Break Times. This needs to be done at each machine once each day preferably in the morning after 12:00AM. This will establish the Lunch & Break Times for the day. This takes less than a Minute!
What about Weekends? On Friday & Monday there is an additional RRC File that covers the Weekend times when a machine is "Not Scheduled". These RRC Files are also pre-configured so all an operator has to do is upload each of these RRC files on Friday & Monday.
If there are changes required these RRC Files can be easily modified before uploading! The changes would be made on Monday to reflect any changes to the Weekend Schedule!
Buddy can you spare 4 Minutes? For a mire 4 minutes a week per machine, you can include OOE Calculations! Now that's "Push Button Monitoring"!
Click here for one the best explanation I've seen for: TEEP, OOE & OEE
When you want to put in no Effort but want to Monitor
When you want to put no Effort in but still want to Monitor, ShopFloorMonitoring provides the Answer.
Once you setup the automatic insertion of Macros you never have to do anything again! Just sit back and the "Machine Status Window", "ShopFloorCharts" & the ShopFloorReports will indicate when you are not meeting your normal Cycle Times which is the No Effort Monitoring: Performance is indicated via "Machine Status Window", "Real-Time ShopFloorCharts" & 8 Performance ShopFloorReports!
Buddy can you spare a Dime For a mire zero minutes a week per machine, you can reap all the benefits from "No Effort Monitoring" and it doesn't cost an additional Dime!