ShopFloorIIoT: Discrete Machine Monitoring based on the Tenets of The Fourth Industrial Revolution

ShopFloorIIoT is Discrete Manufacturing Machine Monitoring Application based on a subset of the Tenets of The Fourth Industrial Revolution specifically IIoT: Industrial Internet of Things.
Within this subset we are focused specifically on Machine Tools in a Discrete Manufacturing Environment.
These Tenets include edge computing, real-time data mining, real-time data-analysis Tools, real-time exchange of data using an industrial standard protocol, Mqtt, based on the subscribe/publish paradigm, real-time feedback, real-time storage/retrieval of this mined data, and the supporting Analysis Tools.
Using these "Tools" to Analyze the Mined & Stored Data, provides every Stakeholder from Operators, Technical Engineers, and any level of Management with All of this Data Graphically Displayed in easy to comprehend Charts representing the past, present, and future production states of the Manufacturing Shopfloor!
Using ShopFloorIIoT will increase productivity, machine tool effectiveness, process efficiencies, quality, enhance decision making for improving competitiveness.
All of this is founded on the Tenets of The Fourth Industrial Revolution providing a path for Discreate Manufacturing to start the journey from the Third Industrial Revolution to The Fourth Industrial Revolution starting today.
ShopFloorIIoT is built on top of ShopFloorManager’s 40 Years of Time Tested SQL Automation & DNC Solutions.
The years 2021, 2022, and 2023 have seen major advancements in CCI’s product development and market focus which has and is determining ShopFloorManager’s direction.
Manufacturing is quickly adopting technologies that are helping them to compete in an ever-changing market. This market is quickly embracing The Industrial Revolution 4.0 and its associated technologies.
There is always hype associate with changing market directions, but the fact is The Industrial Revolution 4.0 is here and is changing how manufacturing uses new & existing equipment/technologies to collect, analyze & distribute virtually all data in real-time in pursuit of the Holy Grail. The Holy Grail is to collect any and all data even if a company isn't going to use it now. We are collecting, analyzing virtually every piece of useful data and analyzing and displaying it in Real-Time!
How is this going to help right now? That same question was asked when computers were first introduced into manufacturing during The Industrial Revolution 3.0. Computers definitely changed industry, hugely in manufacturing but created a paper nightmare! Vast amounts of knowledge were contained in this paper nightmare with little or no organization or access!
The Industrial Revolution 4.0’s provides the "Foundation" to motivate the "harvesting" all this meaningful data(digital & paper) and store it into an organized digital format and make it available to any stakeholder who wants to mine it for its vast cache of knowledge. Stakeholders are not just Users but other Systems such as ERP, Maintenance, etc.
This Data is then used to intelligently tie all business’s facets together to maximize a Company's Goals. These Goals are not just the Business's but include it's "Position" within Society. This is consistent with the Industrial Revolution 4.0's Goals!
What options are open to companies that are heavily invested in legacy equipment and technologies so they can also find a path to the economical benefits of being part of This Industrial Revolution instead of withering away in 3.0?
Well, most companies, can’t afford to purchase new equipment or modify their existing Machine Tools because of the costs, the time lost to upgrade equipment and additional training needed to implement these changes.
So how does one find a path to join The 4.0th Revolution with legacy equipment & technologies?
The most effective path is to gather & analyze as much data as possible from every piece of existing equipment with minimal changes in order to maximize their effectiveness quickly & economically!
ShopFloorIIoT's Basic & Advanced Algorithms along with Off-The-Shelf software/hardware can be used to collect, analyze and display this data based on the International Standards: OEE, OOE, TEEP, Mqtt(Unified Naming Space) & its ShopFloorIIoT Suite of Graphics & various visual Tables.
You may think that your equipment is not capable of having it's data mined or processed, Not So! There are ways to help you find your Hidden Machine!
There are multiple ShopFloorMonitoring Applications, ShopReport & Addons that support legacy Machine Monitoring & our IIoT Suite of Apps so users can use legacy and real-time Production Status aided by the numerous tools available for locating specific & general production problem areas.
Using these tools CCI will work with its customers to help them improve their OEE... results so their ShopFloor operates more effectively making them more productive.
As we gain more knowledgeable with Lean & Six Sigma Philosophies we will be passing this knowledge on our customers so they will better understand how these can be used to improve their business.
Starting in January of 2023 we will be publishing a monthly Newsletter addressing topics such as ShopFloorManager's Technologies, IIoT, Lean, Six Sigma and Topics highlighting the benefits of adopting these Philosophies.
We will also be publishing a Newsletter addressing how to effectively use the various features of ShopFloorManager & including videos that address "How to do(s)"!
We will also be updating our User Manual once a month incorporate new features, correcting errors and clearing up areas that are not as clear as they should be! Feed-Back on this would be much appreciated.
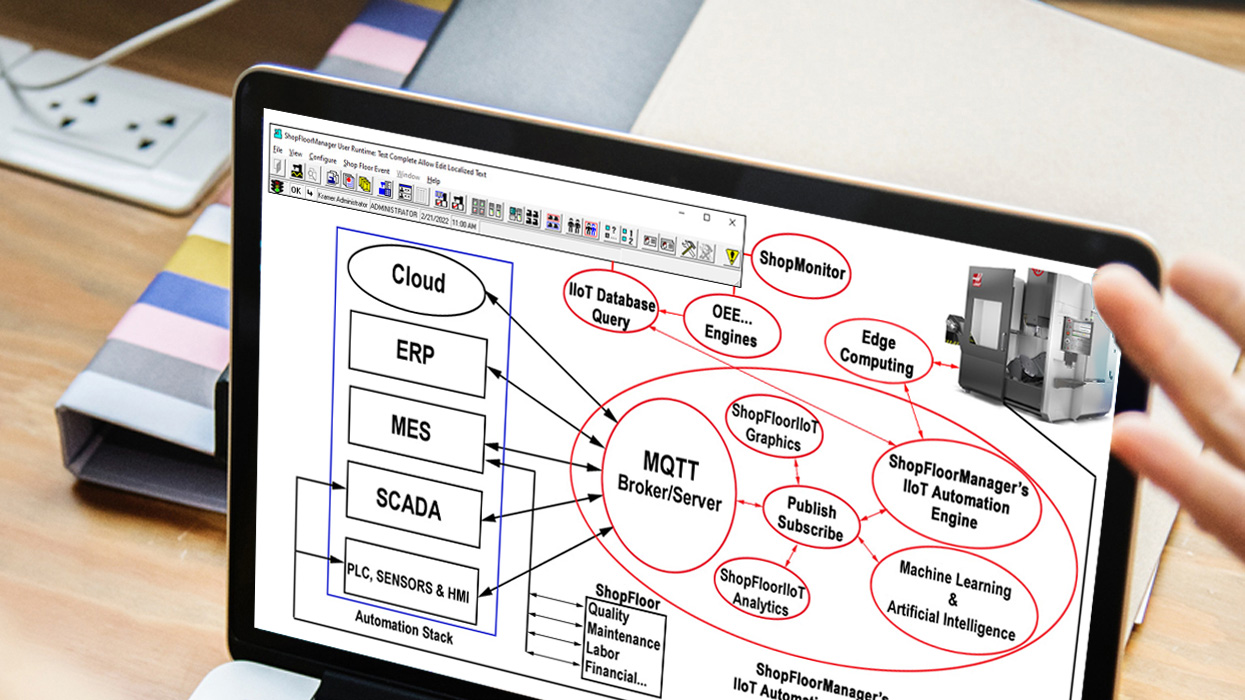
Edge computing is a distributed computing paradigm that brings computation and data storage closer to the sources of data. This is expected to improve response times and save bandwidth. It is an architecture rather than a specific technology. It is a topology- and location-sensitive form of distributed computing.
The origins of edge computing lie in content distributed networks that were created in the late 1990s to serve web and video content from edge servers that were deployed close to users. In the early 2000s, these networks evolved to host applications and application components at the edge servers, resulting in the first commercial edge computing services that hosted applications such as dealer locators, shopping carts, real-time data aggregators, and ad insertion engines.
Internet of things (IoT) is an example of edge computing. A common misconception is that edge and IoT are synonymous.
Credits: -Wikipedia- Edge Computing
The MQTT broker is a piece of software running on a computer (running on-premises or in the cloud), and could be self-built or hosted by a third party. It is available in both open source and proprietary implementations.
The broker acts as a post office. MQTT clients don't use a direct connection address of the intended recipient, but use the subject line called "Topic". Anyone who subscribes receives a copy of all messages for that topic. Multiple clients can subscribe to a topic from a single broker (one to many capability), and a single client can register subscriptions to topics with multiple brokers (many to one).
Each client can both produce and receive data by both publishing and subscribing, i.e. the devices can publish sensor data and still be able to receive the configuration information or control commands (MQTT is a bi-directional communication protocol). This helps in both sharing data, managing and controlling devices. A client can not broadcast the same data to a range of topics, and must publish multiple messages to the broker, each with a single topic given.
With MQTT broker architecture, the client devices and server application become decoupled. In this way, the clients are kept unaware of each other's information. MQTT, if configured, can use TLS encryption with certificate, username and password protected connections. Optionally, the connection may require certification, in the form of a certificate file that a client provides and must match with the server's copy.
In case of failure, broker software and clients can automatically handover to Redundant/automatic backup broker. Backup brokers can also be set up to share the load of clients across multiple servers onsite, in the cloud, or a combination of these.
The broker can support both standard MQTT and MQTT for compliant specifications such as Sparkplug.[20] This can be done with same server, at the same time and with the same levels of security.
The broker keeps track of all the session's information as the device goes on and off, in a function called "persistent sessions". In this state, a broker will store both connection info for each client, topics each client has subscribed to, and any messages for a topic with a QoS of 1 or 2.[21]
The main advantages of MQTT broker are:
Credits: -Wikipedia- MQTT
These Engines are designed to query ShopFloorManager's SQL Databases retrieving relevant data, processing it using IIoT Analytics to publish it to the IIoT Dashboards according to the data's type! I.E. OEE, OOE, TEEP, Machine Rates, OEE... Details, Machine Status and Alarm Logs.
Because of the inherent capabilities of IIoT Analytics/Graphics this published "data" is available on the Web without having to create specific graphics software for displaying. All of this can be viewed on any browser from anywhere in the World, subject to network Security!
This section will deal with the various Selections accessible by ShopFloorIIoT's Dashboard's dropdown-content.
We designed and developed ShopFloorIIoT to take advantage of our fully integrated system allowing any stakeholder with the rights to configure their Workstation/Tablet independently of other Workstations/Tablets to meet their specific on-the-fly needs.
These selections can be taken directly from the complete machine tool drop-down list, a defined group of machines or a combination of both. We provide complete flexibility since the ShopFloor is an ever changing Environment that can't be predefined!
Generally an operators only needs to now the present state of their machine or machines! Let's quickly see what that looks like!
ShopFloorIIoT Screen Dashboard Displays are unique in our Industry as they are all exactly the same and can be used on Mobile Phones, Tablets, PC Monitors & Large Screen Displays. Since a Stakeholder can configure which Machines & Options to display and by using the mouse wheel to size, virtually any Display Configuration that is acceptable for viewing can be created.
A Stakeholder who has the rights can login to any PC displaying any Screen and configure it remotely! In fact they could give a presentation remotely subject to connecting to speakers.
This Menu/Tools deals with the International Standard OEE & it's siblings, OOE & TEEP. This standard has become the de-facto Standard for "Measuring" Machine Tool Effectiveness. In this section we will investigate how ShopFloorIIot applies Analytics to the Machine Data it collects to maximize OEE's Promise!
The dashboards are an integral part of ShopFloorManager acquiring all of its data from ShopFloorManager's SQL Database. Each workstation is an independent entity where every Stakeholder has control of its configurations. They can re-configure it's options on the spot to meet their immediate requirements.
In the following we will be investigating three different configuration screens available to a Stakeholder for selecting and configuring various Graphical Reports depending on their User Rights.
This Menu/Tools deals with the International Standard OEE & it's siblings, OOE & TEEP. This standard has become the de-facto Standard for "Measuring" Machine Tool Effectiveness. In this section we will investigate how ShopFloorIIot applies Analytics to the Machine Data it collects to maximize OEE's Promise!
Everything starts with the Machine Tool since this is the where data "coalesces". This probably is not true in Technical sense but it is the Point of Interest when discussing OEE.
What follows briefly describes the Menu Selections/Uses to accomplish the Promises of OEE. These Promises will only come to fruition if Stakeholders embrace the technologies built around OEE!
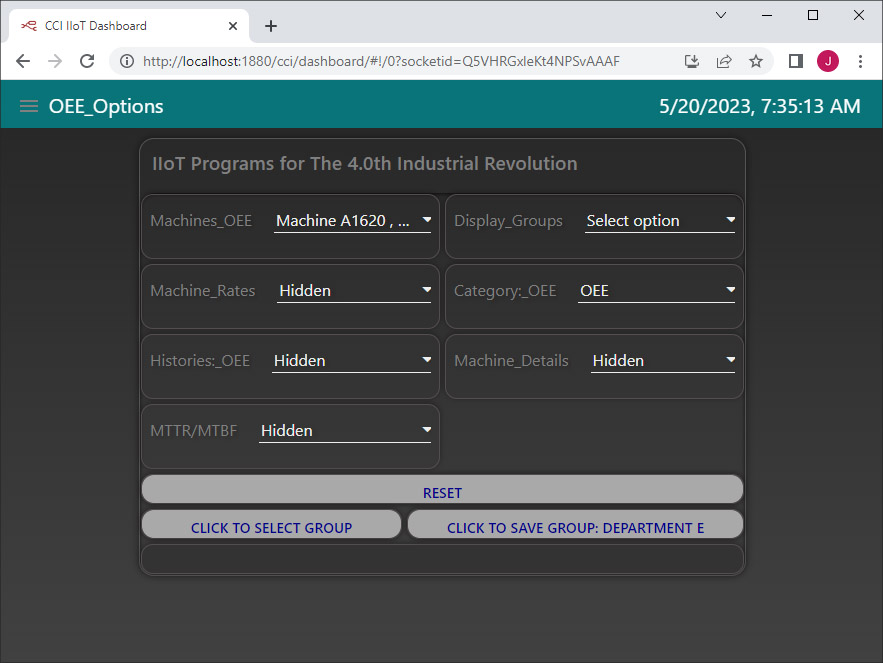
The first step is to select the particular Machines for which you would like to investigate its OEE Results. ShopFloorIIoT's Menu Selection, OEE_Options, allows a Stakeholder to individually add or remove any Machine Tools from the list of Machines. Only the selected Machines and associated Options will be used in the resulting OEE_Results.
When there is a large number of Machines modifying the list each time a different list of Machines is needed can be pain. That is why we included Machine Groups which allows a Stakeholder to associate any number of different Machines to any of the 20 Groups supplied.
Each Workstation has it's own private set of Groups. At the bottom of the Menu you can use the two buttons to select & save the selected Machines to chosen Group. If you want to create a Group that includes Machines from another Group, select that Group first and then add or remove Machines to create a new Group. Groups can contain any random selection of Machines providing complete flexibility.
One of the many by-products of collecting Machine Monitoring Data for OEE, Specifically TEEP, is that it provides the base information not only for determining Machine Effectiveness but a ground zero for how your machine's time is used. When combined with your company's: Machine Cost/Hour, Labor Cost/Hour, Overhead/Hour & Percent Markup (0 to 100%) you can determine a Universal Base Hourly Machine Rate based on a TEEP value of 100%.
Even though you will never achieve 100% TEEP Rate it provides a universal measure that is the same for every company. ShopFloorIIoT has used this measurement/data to provide four different Hourly Machine Rates(real-time) that your company can use to price their jobs.
Note: See the Heading above "A Machine Configured for All Options" for a quick view!
Another set of calculations that can be carried out based on the data collected is the (MTTR) Mean Time To Recover and (MTBF) Mean Time Before Failure. These are used to provide a bases for determining when a failure may happen and how long it takes to return to production.
As is almost always the case when when you look at a result you want to compare it against a "Standard" and or past Results. ShopFloorIIoT provides these histories based on Today, The last 7 Days and Last Full Month. OEE... is the Universal Standard & the Results are the base on the Data your company has collected. This provides a non-biased Result(s) for how Effective your company is in using its Machines & Time.
One of the Problems with using OEE... as a measurement, is that it is an Abstract Number that at first is meaningless to a Stakeholder. You know that a higher number is better but that's about it! That is why ShopFloorIIoT generates & displays three concrete results for a Stakeholder to compare against the OEE... numbers making the Abstract Number Concrete. It is then easy to see the connection between the Abstract & Concrete. For an example see the Heading above "A Machine Configured for All Options" for a quick view!
This Menu is really a List of all of the "Tools" needed to address any Workstation's, Production's, Quality's, Maintenance's, Information's... Present Issues along with Pareto & Analysis Charts which are used to locate any and all manufacturing variances based on the OEE... Results.
These "Tools" can analyze & visually display any Production, Quality, Maintenance, etc. and goal variances. These variances can then be shared with any and all concerned Stakeholders. The resulting variances can easily be displayed in a very broad(Thousands of Machine Events) to a very narrow(Single Machine Events) Sets of analyzed results. These results can then be used to address variances with the Company's and any Stakeholder's Goals.
Because of the ability to display individual Machine Events as needed, the validity of the data isn't in question. This allows for exploring areas of possible improvements with a Stakeholder without biases and without the Stakeholder feeling they are unduly being singled out for criticism! Actual Organized "Raw" Data takes no sides!
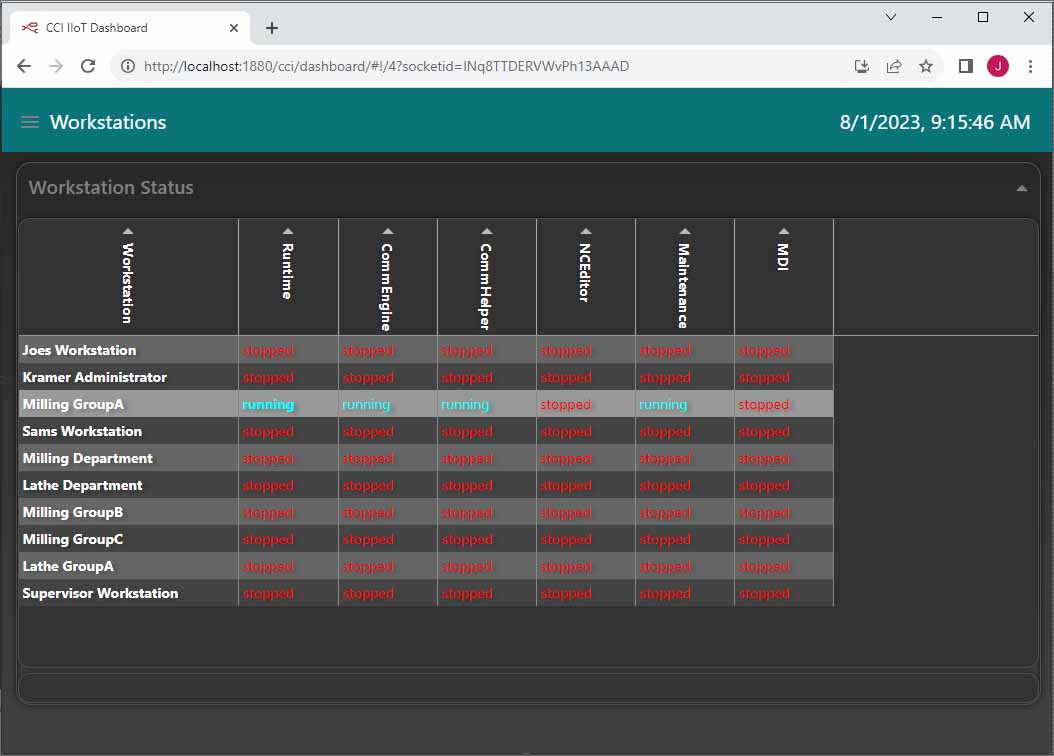
ShopFloorManager's ShopFloorIIoT Dashboards provides all of the Workstation Activities/States of every ShopFloorManager Workstation's Apps. This can be used by your personnel such as "IT" when the State information is critical for performing network wide services or by any interested Stakeholder.
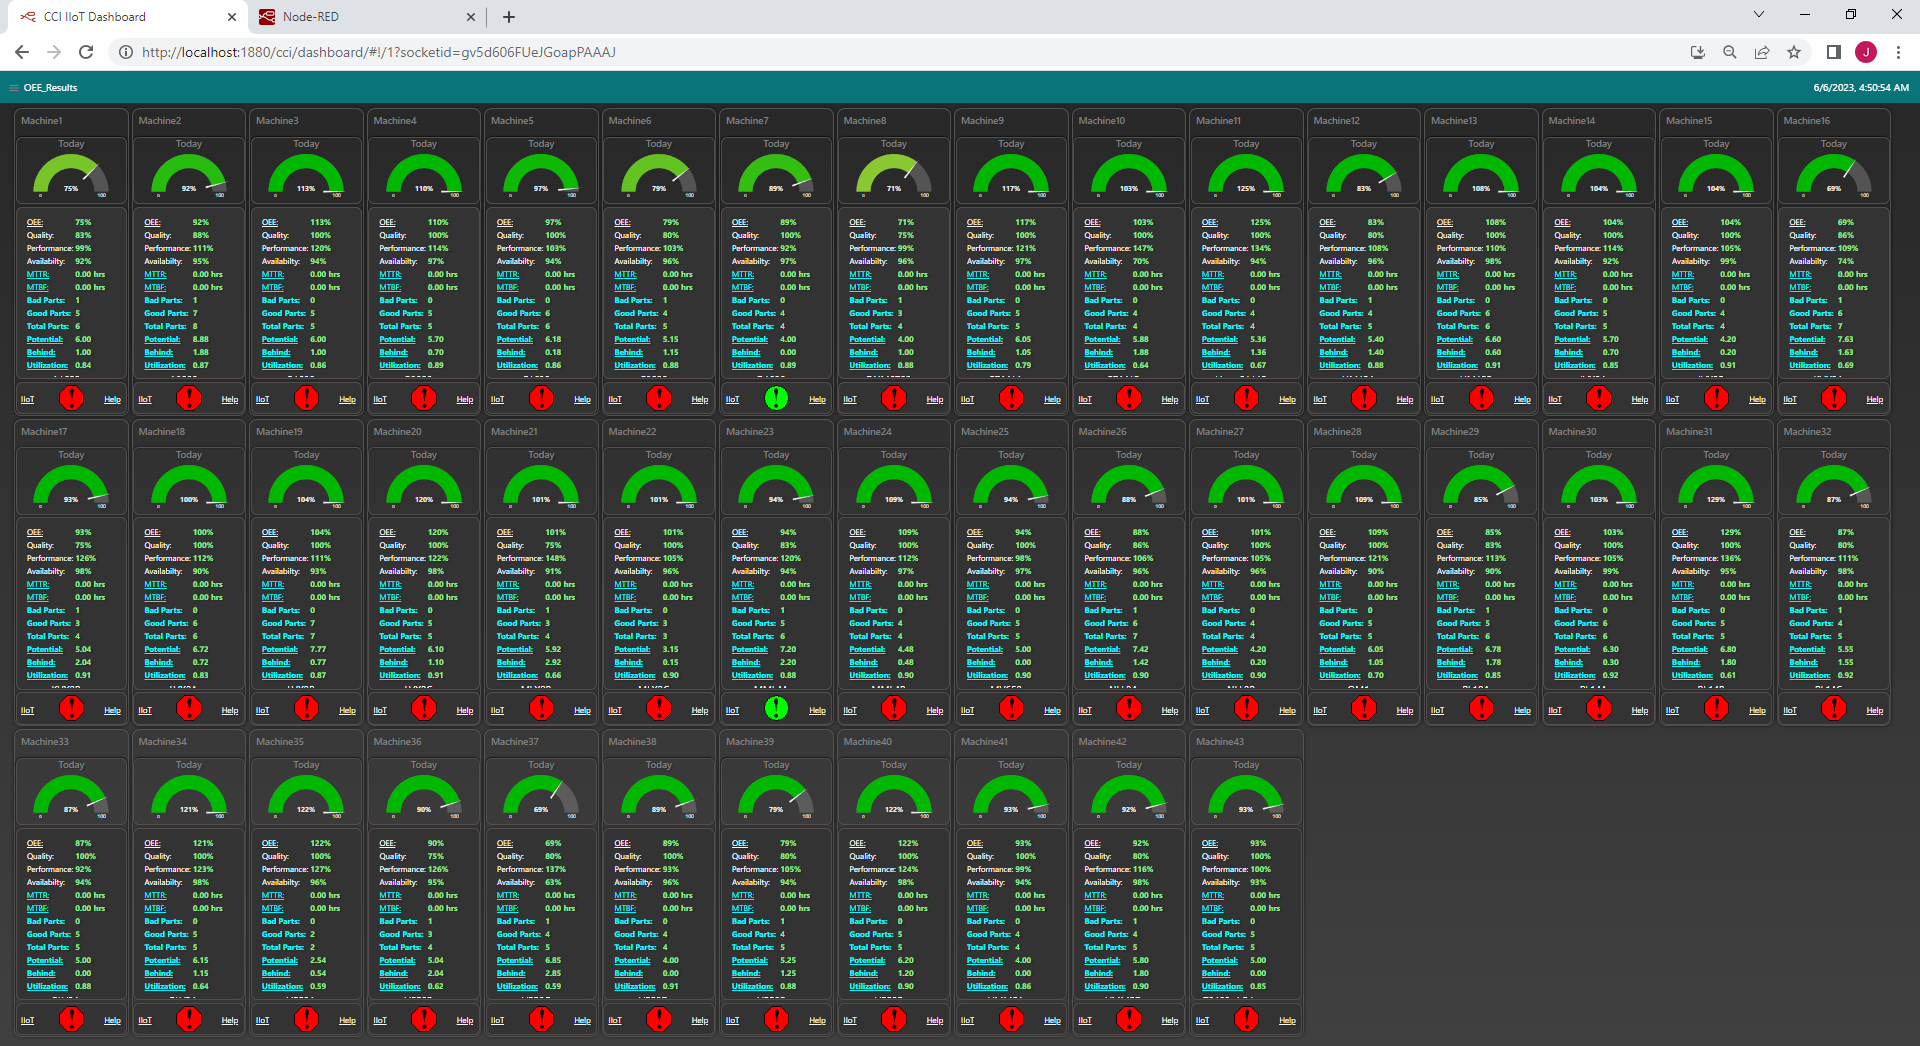
One of ShopFloorIIoT's Goals is to provide a Single Screen for a particular Manufacturing Activity where any Stakeholder can find all of the information needed to determine what, if any Actions, need to be addressed.
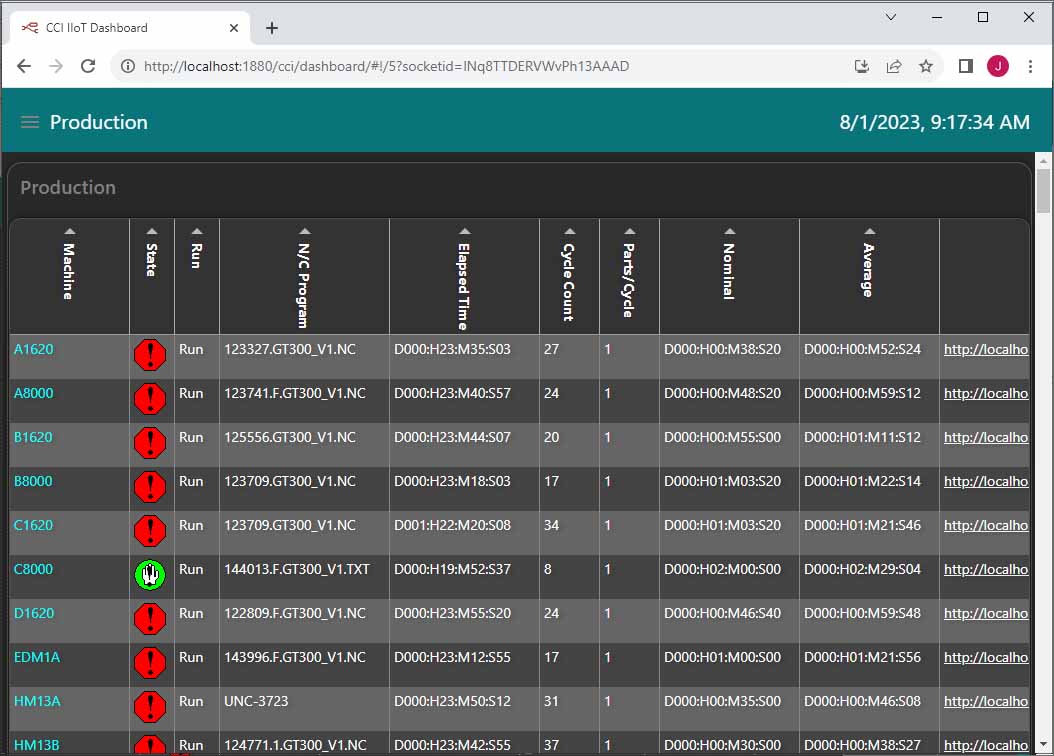
This lead us to create a Screen Paradigm where every Machine in the plant is displayed with an Accurate Depiction of it's Production State. All the Stakeholder has to do is scroll thru the list first looking at each Unique Icon that Indicates it's Present Production State. There are three separate tables on this Screen: Production, Setups and Logins.
When a Stakeholder finds a Machine of Interest they can stop and investigate by looking at the record/data displayed then taking any Actions needed!
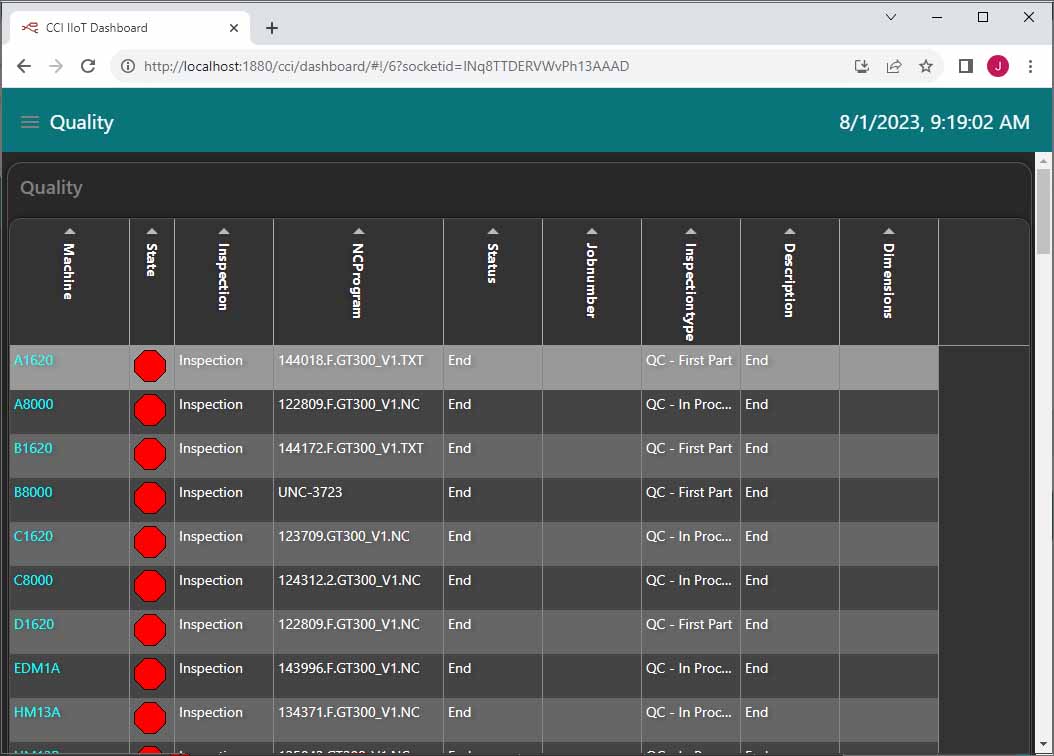
Using the ShopFloorIIoT Screen Paradigm where every Machine in the plant is displayed with an Accurate Depiction of it's Quality State. All the Stakeholder has to do is scroll thru the list first looking at each Unique Icon that Indicates it's Present Quality State. There are two separate tables on this Screen: Inspections & Badparts.
When a Stakeholder finds a Machine of Interest they can stop and investigate by looking at the record/data displayed then taking any Actions needed!
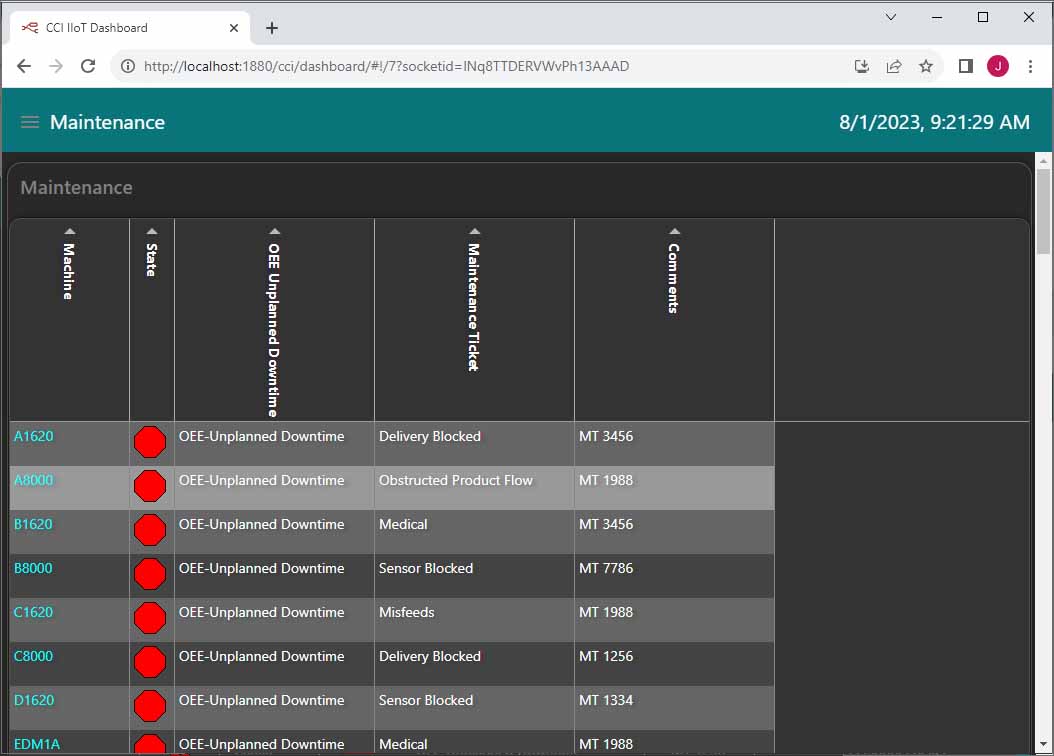
Using the ShopFloorIIoT Screen Paradigm where every Machine in the plant is displayed with an Accurate Depiction of it's Maintenance State. All the Stakeholder has to do is scroll thru the list first looking at each Unique Icon that Indicates it's Present Maintenance State. There are two separate tables on this Screen: OEE-Unplanned Downtime & OEE-Planned Downtime.
When a Stakeholder finds a Machine of Interest they can stop and investigate by looking at the record/data displayed then taking any Actions needed!
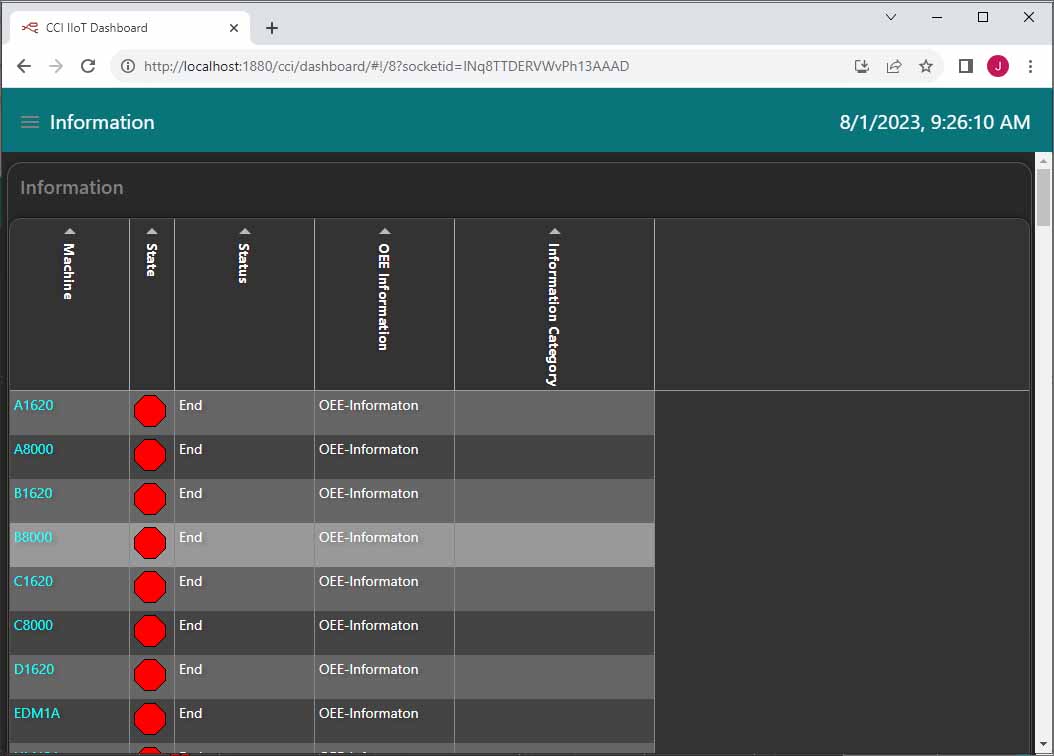
Using the ShopFloorIIoT Screen Paradigm where every Machine in the plant is displayed with an Accurate Depiction of it's Information State. All the Stakeholder has to do is scroll thru the list first looking at each Unique Icon that Indicates it's Present Information State. There are two tables on this Screen: OEE-Information & Wrappers.
When a Stakeholder finds Machines of Interest they can stop and investigate by looking at the records/data displayed and then take any corrective Actions needed!
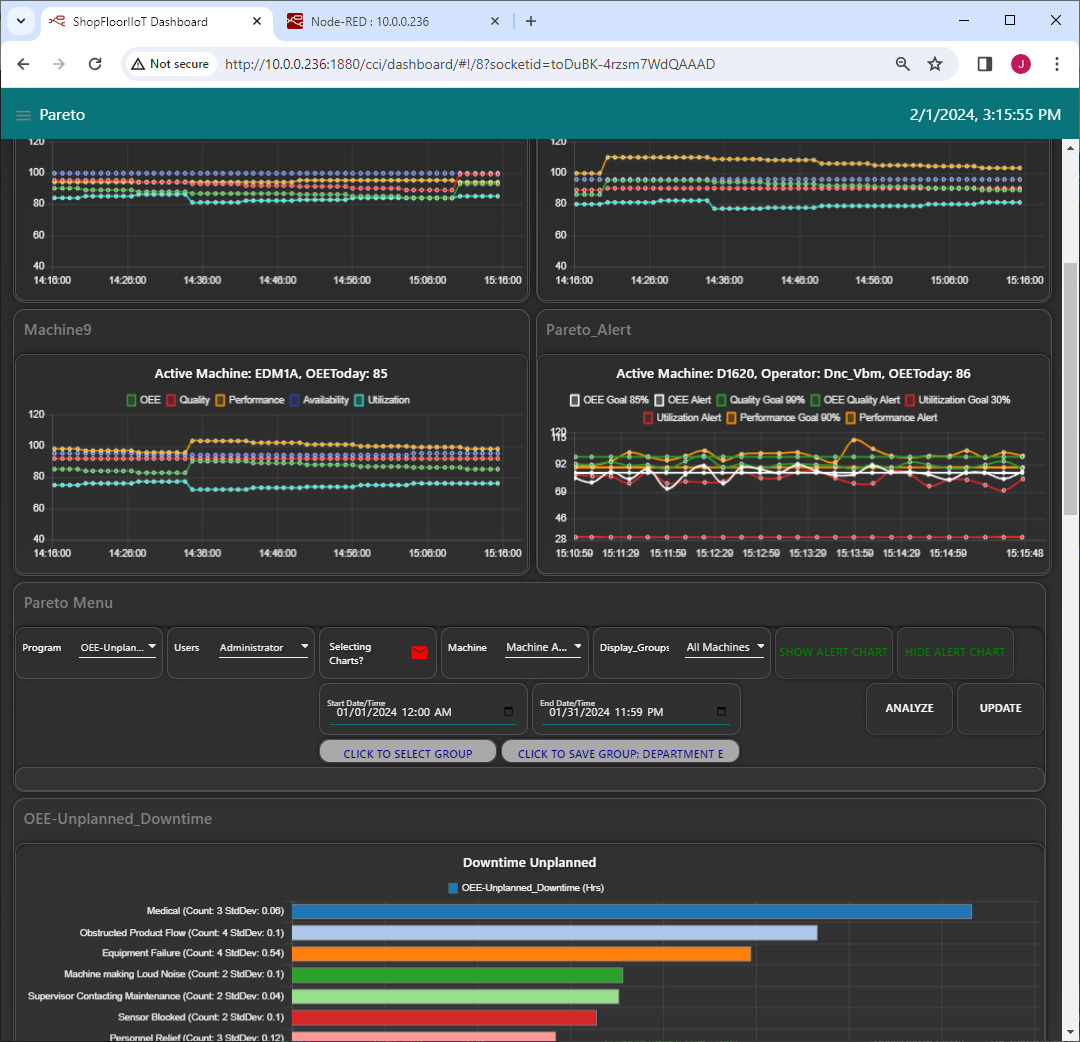
A Pareto chart is a bar graph. The lengths of the bars represent frequency or cost (time or money), and are arranged with longest bars on the top/left and the shortest to the bottom/right. In this way the chart visually depicts which situations are more significant. This cause analysis tool is considered one of the seven basic quality tools.
After thinking about how we can extract as much information out of the collected Machine Events/Data to actually maximize it usefulness we concluded that piling every single Downtime Event Reason into a single Chart/Table was not the most effective way to locate and isolate areas of possible improvement.
Since our Monitoring Programs(Customer Creatable) are specifically dedicated to a particular Downtime: Setup, Inspect, Planned, Unplanned, etc., it made sense to have a specific Pareto Chart dedicated to this specific Downtime so you don't have to separate the "Wheat from Chaff". Given the Goal to provide Process improvements as quickly as possible this is one of the best ways.
You can select the specific Monitoring Program to Analyze the collected data creating a unique Pareto Chart for that Program. See the drop-down selection above.
The Date/Time Pareto Configurations allow a Stakeholder to use the Pareto Charts/Tables to analyze any data for any date/time/shift what so ever. This allows a Stakeholder complete freedom to investigate any and all downtime reasons for this Time Frame!
This is a list of all of the Machines available. This list has two Roles, one is to select any combination of Machines to use in the Query and to create a Machine Group. See below.
ShopFloorIIoT provides Machine Groups where each Workstation can create up to 20 Groups with any combination of Machines in each Group.
Use the Machine Drop-Down Selection List and select the Machines you want to be included in a Group, then select the User Group you want to create using the Left Hand Button and then click on the Right Hand Button to Save.
That's it! To view the Machines in the a Group, select the Group and look at the Machines List. If you temporarily need additional Machines just select from the Machine list but don't save to any Group!
After configuring all of the needed settings for the Analysis the Button should turn Red. Click the Analysis Button to start the Analysis.
To reset settings click on the Reset Button.
Select an Monitoring Program and configure all of the options before clicking on the Analyze Button which Queries the database for all instances of the Monitoring Program Choice. The returned objects are then Analyzed by ShopFloorIIoT where every unique "Downtime" Reason is collected, labeled and its count & time are summed and presented in the Pareto Chart.
The Visual Results are displayed in the Chart while all of the Machine Monitoring Events are displayed in the interactive Table below. Any of the Table Heading can be clicked and the Headings and instantaneously reorder in descending or ascending the Table records, making it possible to look at these Events/Data based on a multiple of views.
Remember that every Monitoring Event ever instanced is displayed based on your configuration choices and the Sorting of the Headers. This is where your Possible Solutions are presented to you in a non-biased View! To dig deeper use the Analysis Chart!
This category is really not a Downtime Event but a list of suggestions submitted any Users for improving a Company's Competitiveness via Safety, Efficiencies, etc. In this Chart/Table lies the future improvements and directions a company's will take to keep its competitive advantage.
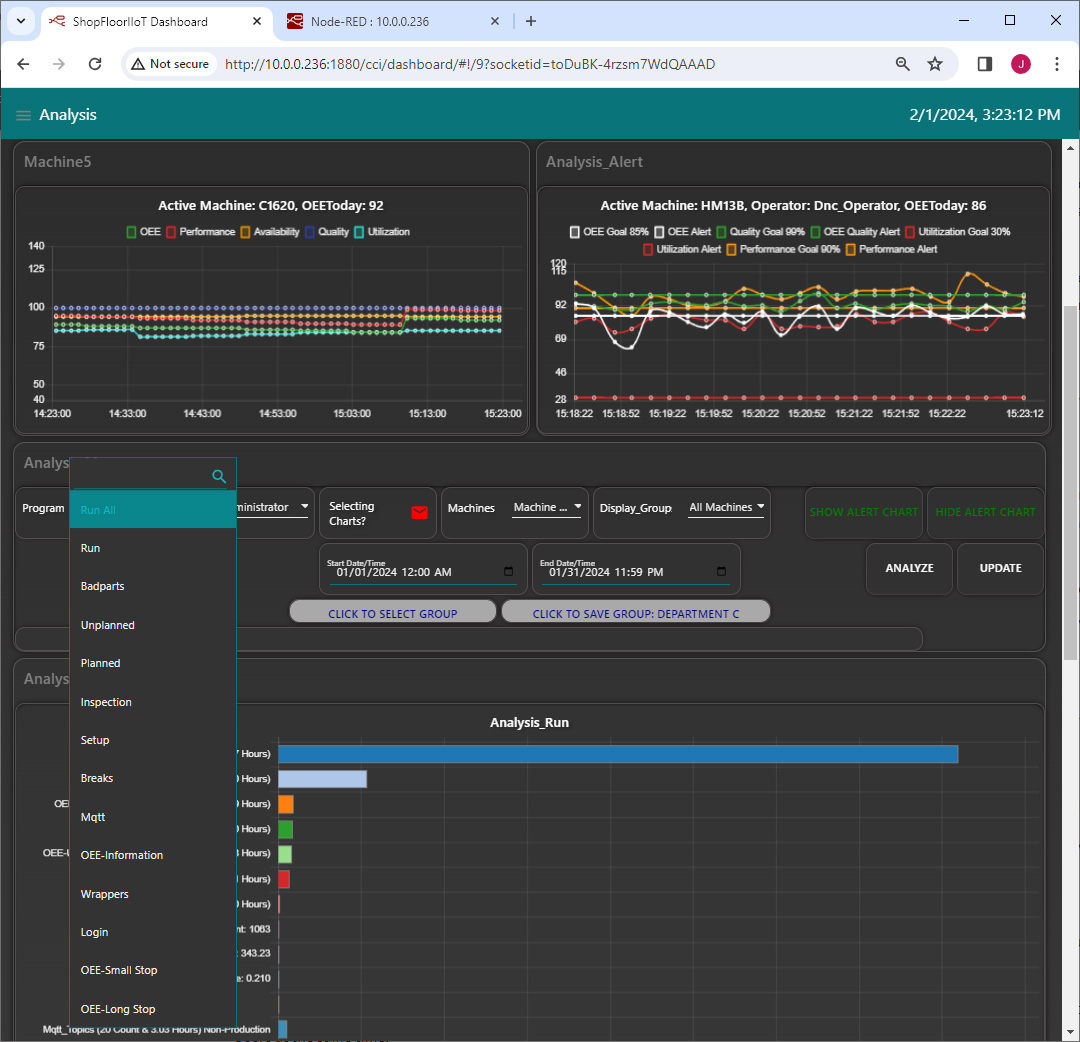
An Analysis chart is a bar graph. The lengths of the bars represent frequency or instances for Particular Machine Monitoring Events and include the accumulated time of these Events. Contrary to Pareto Charts they are not arranged in any particular order.
What is unique about this Chart is that it is configured to display complete Machine Cycles (Run Monitoring Program) and can contain other Monitoring Programs base on a Stakeholder's configuration. These Complete Cycles are displayed in the Table below the Analysis Chart providing the complete histories of all Machine Cycles all of which allow Stakeholder interactive operations.
These Complete Cycle details along with the Analysis Charts provides a Stakeholder Analyst with every bit of information needed to locate any and all "Problem" Areas. An Analyst can then sit down with other responsible Stakeholders and without bias address areas the need improvement.
The Analysis Chart was designed to be able to address every part of The Machining Cycle that is encountered on the ShopFloor relative to OEE & related Data. ShopFloorManager, ShopMonitor & ShopFloorIoT provide legacy & IIoT reports which address not only OEE... but other Areas addressing the present & historical data.
Since our Monitoring Programs(Customer Creatable) are specifically dedicated to a particular Downtime: Setup, Inspect, Planned, Unplanned, etc., it made sense to have a specific Pareto Chart dedicated to this specific Downtime so you don't have to separate the "Wheat from Chaff". Given the Goal to provide Process improvements as quickly as possible this is one of the best ways.
You can select the specific Monitoring Program to Analyze the collected data creating a unique Analysis Chart for each Monitoring(ShopFloor Events) Program. See the Program drop-down selection which address: Run All, Run, Run Badparts, Run Unplanned, Run Setup, Run Inspection, Run OEE-Information. The Run implies the complete Machine Cycle is included in the Graphical Report.
The Date/Time Analysis Configurations allow a Stakeholder to use the Analysis Charts/Tables to analyze any data for any date/time/shift what so ever allowing a Stakeholder complete freedom to investigate any and all "downtime" reasons for the configure Time Frame!
The Analysis Chart includes being able to select Users as part of the Analysis individually or in Groups as Users are included in all Queries.
Note: It is not a good idea to include Every User in any Analysis Chart as it could overload the Analysis Process. There should never be an occasion when this is needed!
This is a list of all of the Machines available. This list has two Roles, one is to select any combination of Machines to use in the Query and to create a Machine Group. See below.
Note: It is very rare that all machines would be used in an Analysis Session. This could overload the Query and fail especially if you select all Users at the same time.
ShopFloorIIoT provides Machine Groups where each Workstation can create up to 20 Groups with any combination of Machines in each Group.
Use the Machine Drop-Down Selection List and select the Machines you want to be included in a Group, then select the User Group you want to create using the Left Hand Button and then click on the Right Hand Button to Save.
That's it! To view the Machines in the a Group, select the Group and look at the Machines List. If you temporarily need additional Machines just select from the Machine list but don't save to any Group!
Select an Monitoring Program and configure all of the options before clicking on the Analyze Button which Queries the database for all instances of the Monitoring Program Choice. The returned objects are then Analyzed by ShopFloorIIoT where every unique "Downtime" Reason is collected, labeled and its count & time are summed and presented in the Pareto Chart.
The Visual Results are displayed in the Chart while all of the Machine Monitoring Events are displayed in the interactive Table below. Any of the Table Heading can be clicked and the Headings and instantaneously reorder in descending or ascending the Table records, making it possible to look at these Events/Data based on a multiple of views.
Remember that every Monitoring Event ever instanced is displayed based on your configuration choices and the Sorting of the Headers. This is where your Possible Solutions are presented to you in a non-biased View! To dig deeper use the Analysis Chart!
After configuring all of the needed settings for the Analysis the Button should turn Red. Click the Analysis Button to start the Analysis.
To reset settings click on the Reset Button.
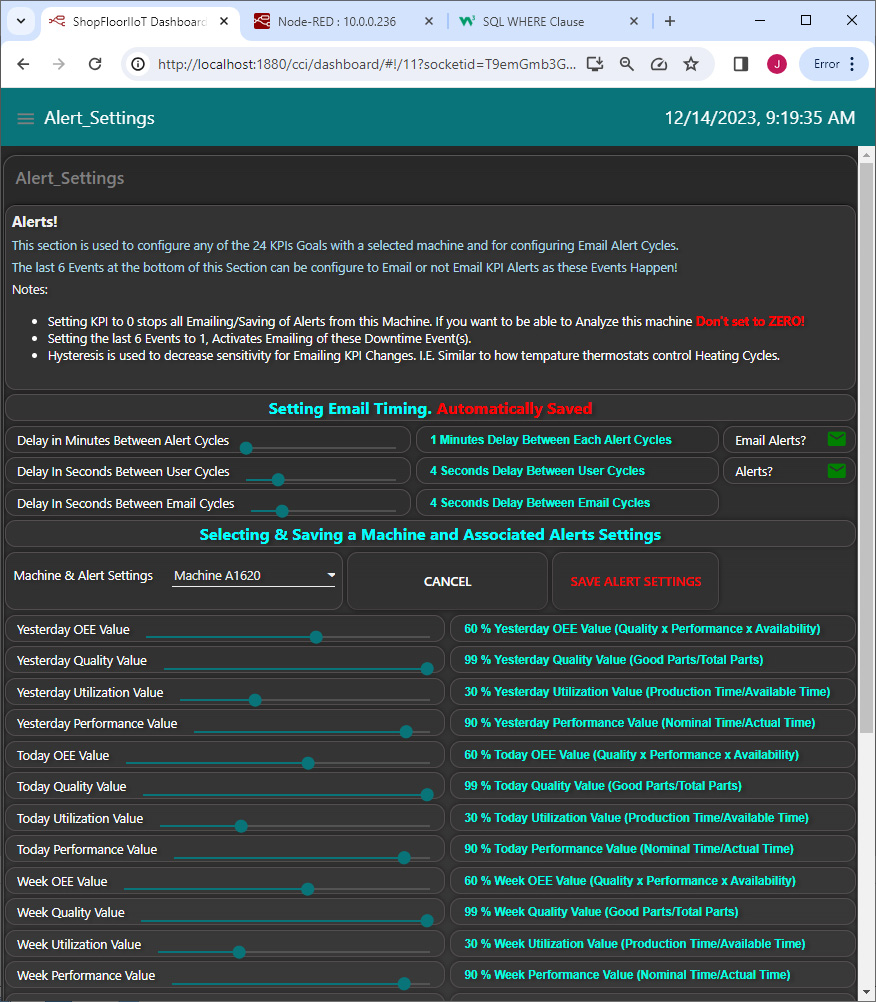
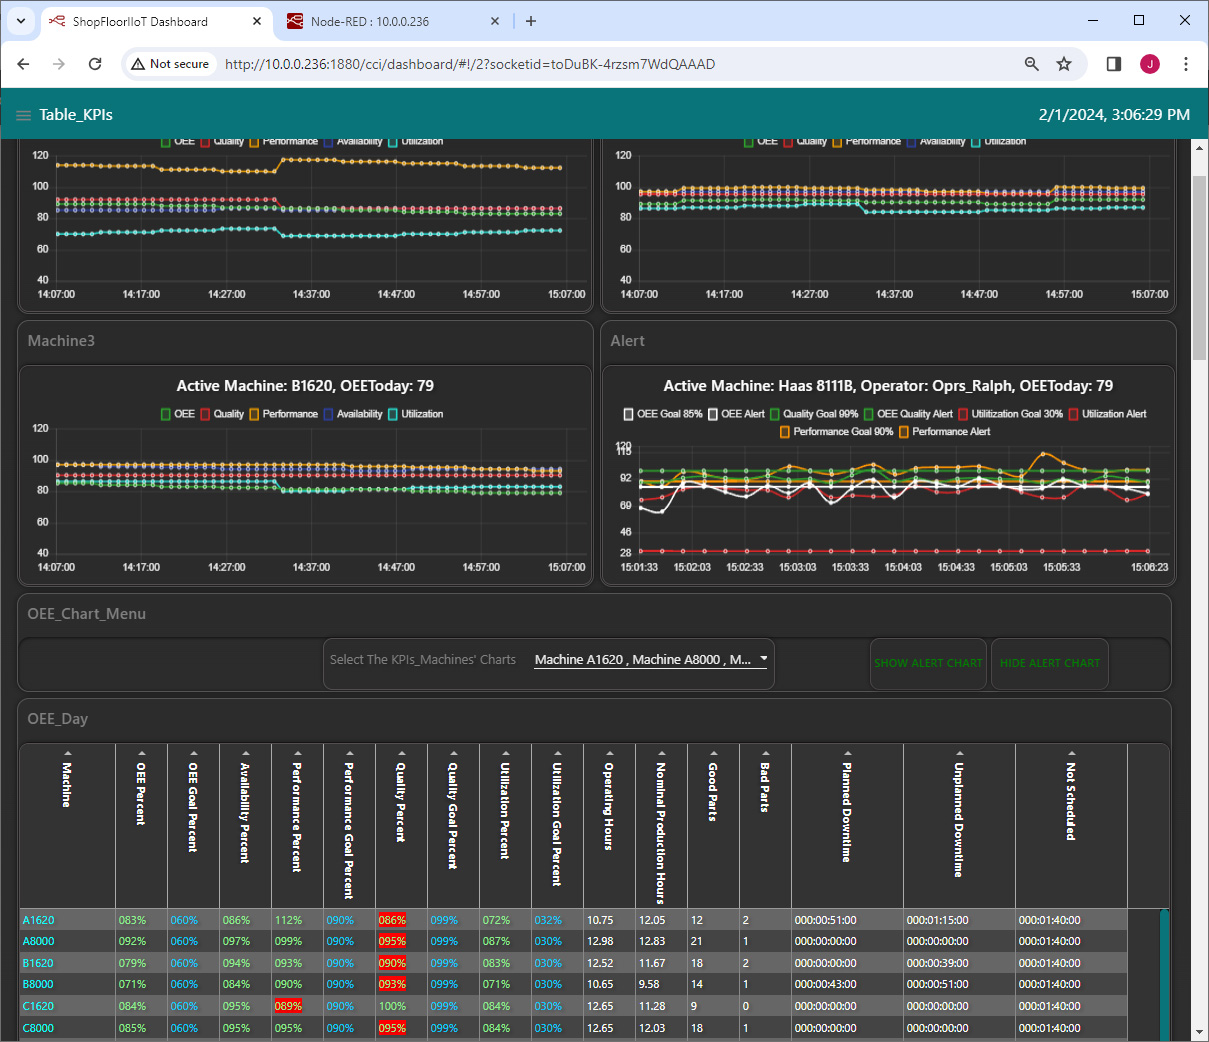
In discrete manufacturing it is almost impossible for any two machines to have the same OEE values because of the nature of OEE.... They would need to be identical, have the same tooling, be running the same parts, have the same Operators, etc.! That's virtually Impossible!
That is why the Alert Settings need to be set for each Machine. These initial values, see above, are based on the International average standards and are used to start your journey. These Standards will also be shown next to your OEE..., Quality & Utilization real-time Values.
In a short time the data you have collected & Analyzed can be used to modify these values to use as Your Base Standards to use as a realistic guide for meeting your company's "improvement" Goals!
ShopFloorIIoT provides that ability to Email the State of each Machine's OEE, OOE, TEEP, Production, Maintenance, Quality, States in Real-Time. These Emails provide all details needed to determine the States of any and all Machines.
If activated, (is set to 1), Emails will be sent out every X hours(Settable from 1 to 24 hours) to the Contacts in the EMail Distribution List which is configured in ShopFloorManager. These Email Contacts are specific to each Machine so only the Stakeholders who are interested in them will receive them.
In essence you create an Email Distribution List for each Machine and populate them with the interested Stakeholder's Email Addresses. When a Stakeholder no longer wants to receive Emails they have their Email Address removed from the Distribution List. If a Stakeholder has ShopFloorManager's User Rights they can do it themselves. See the User Manual for details!
Note: There are times when Immediate Alerts are required and necessary. We support multiple approaches including, receiving Alerts directly from Machines, Edge Devices & Imbedded Events in N/C Files outputting timed events!
Questions? Please use the Contact Form below if you have any suggestions or questions. Thanks for your suggestion & feedback.